National Dish Project
Embark on an exciting voyage through the Data analysis workflow with 200+ diverse national cuisines.
About The National Dish Project
The project aims to promote a better grasp of the data analysis workflow across a wide audience by utilizing a tailored dataset that includes 200+ classic dishes from different countries.


Click an image to learn more about the Dish!
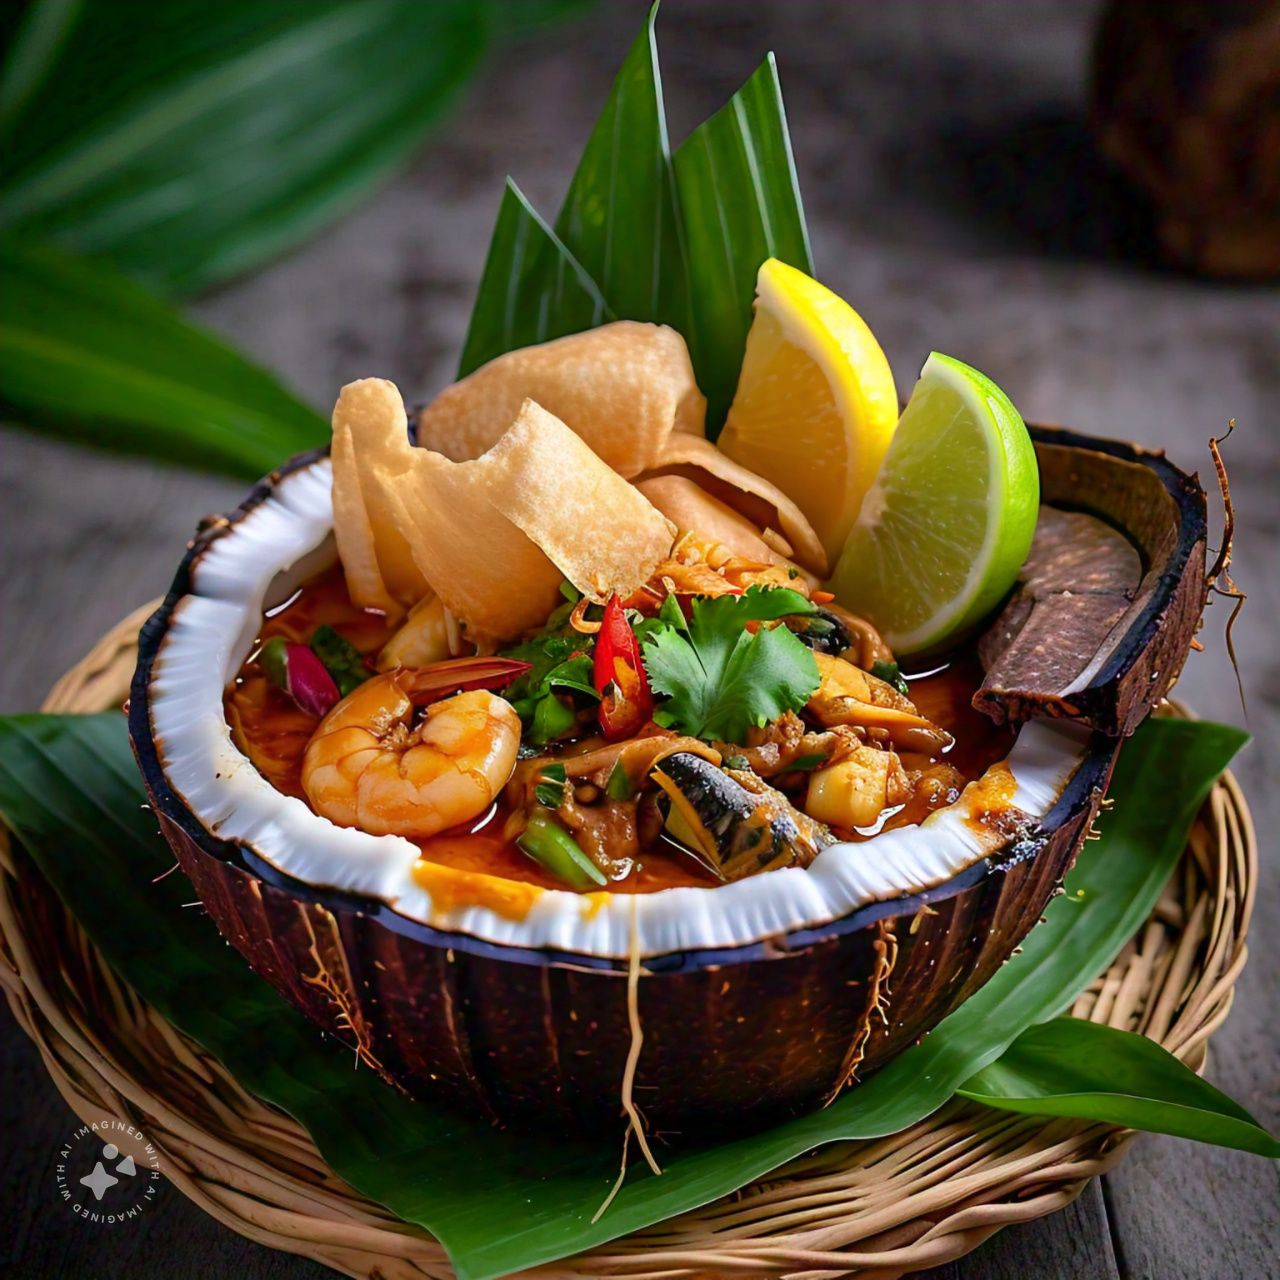
Amok-Trey
Amok Trey (អាម៉ុកត្រី) is a beloved Cambodian specialty that consists of fish cooked in a creamy coconut milk sauce, infused with spices and herbs, and typically wrapped in banana leaves for serving. The word "Amok" highlights the steaming process, and "Trey" simply means fish.
Ema Datshi
Ema Datshi (ཨེ་མ་དར་ཚིལ་) is a popular dish in Bhutan, made with fiery chili peppers (ema) and flavorful cheese (datshi). This dish is a staple in Bhutanese households and is frequently served with rice or noodles. Known for its spicy and savory taste, Ema Datshi is an essential part of Bhutanese culture and culinary tradition.
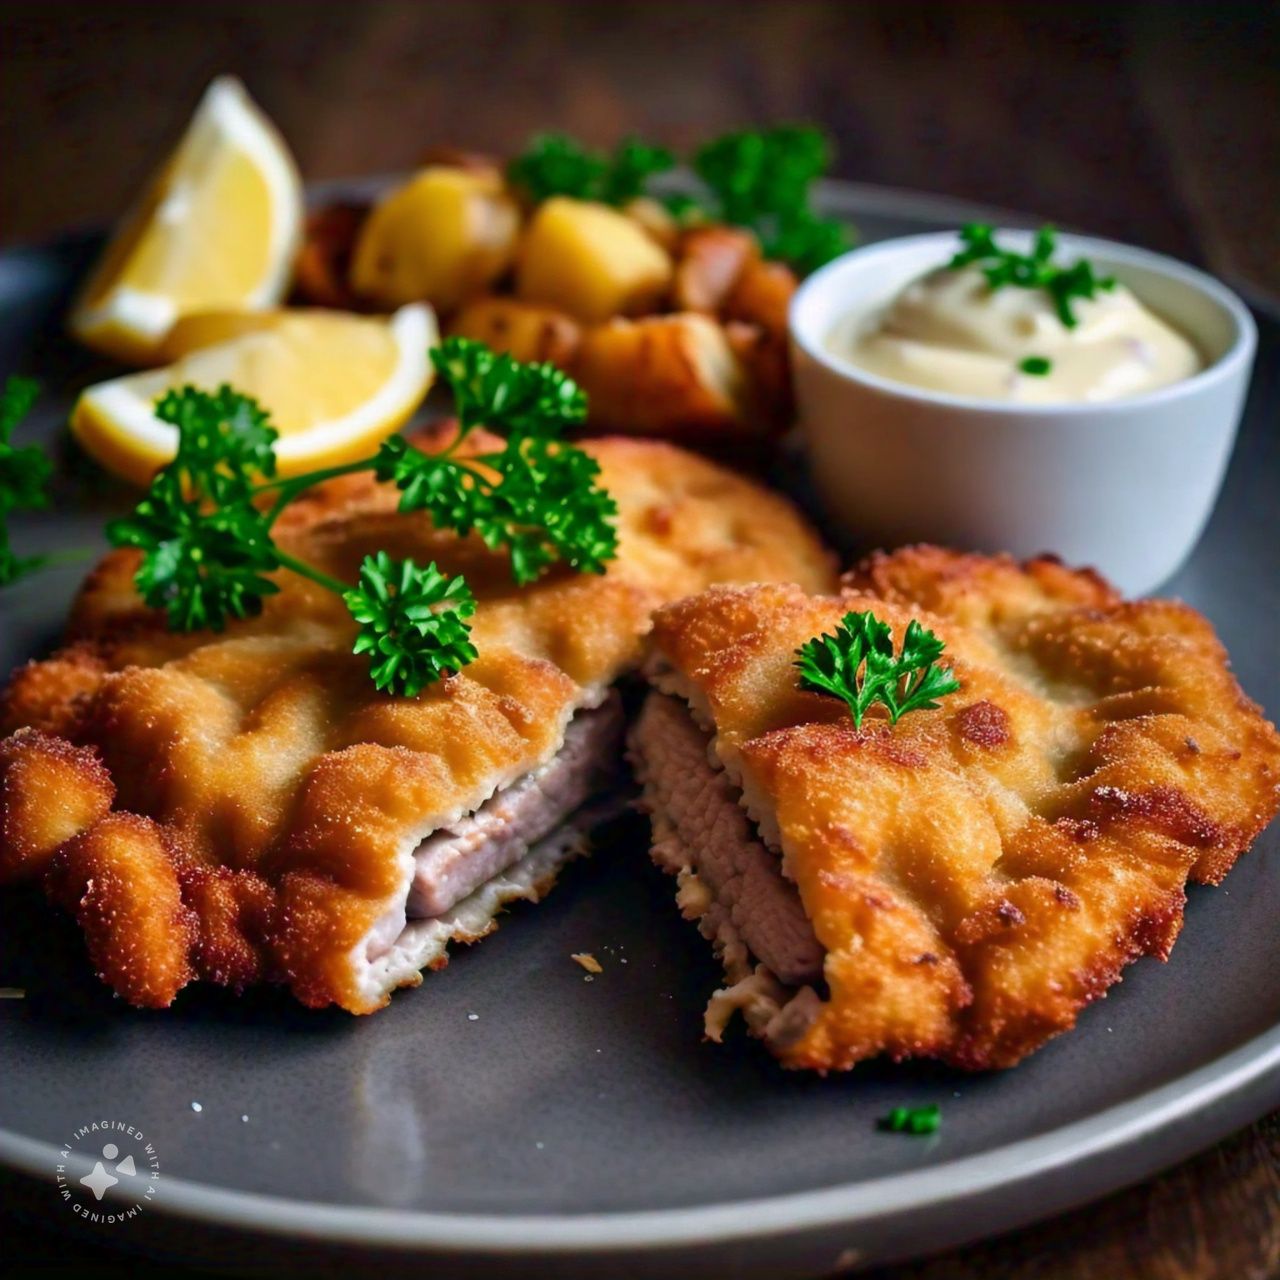
Wiener Schnitzel
Wiener Schnitzel is an iconic dish from Austria, made with a thinly sliced veal cutlet that is breaded and fried until it’s perfectly golden. It’s typically garnished with a lemon wedge and served alongside potatoes, salad, or cucumber. The name "Wiener" highlights its roots in Vienna, where it was first created. Interestingly, the Austrian government has set a rule that only veal can be used for it to be considered the real deal!
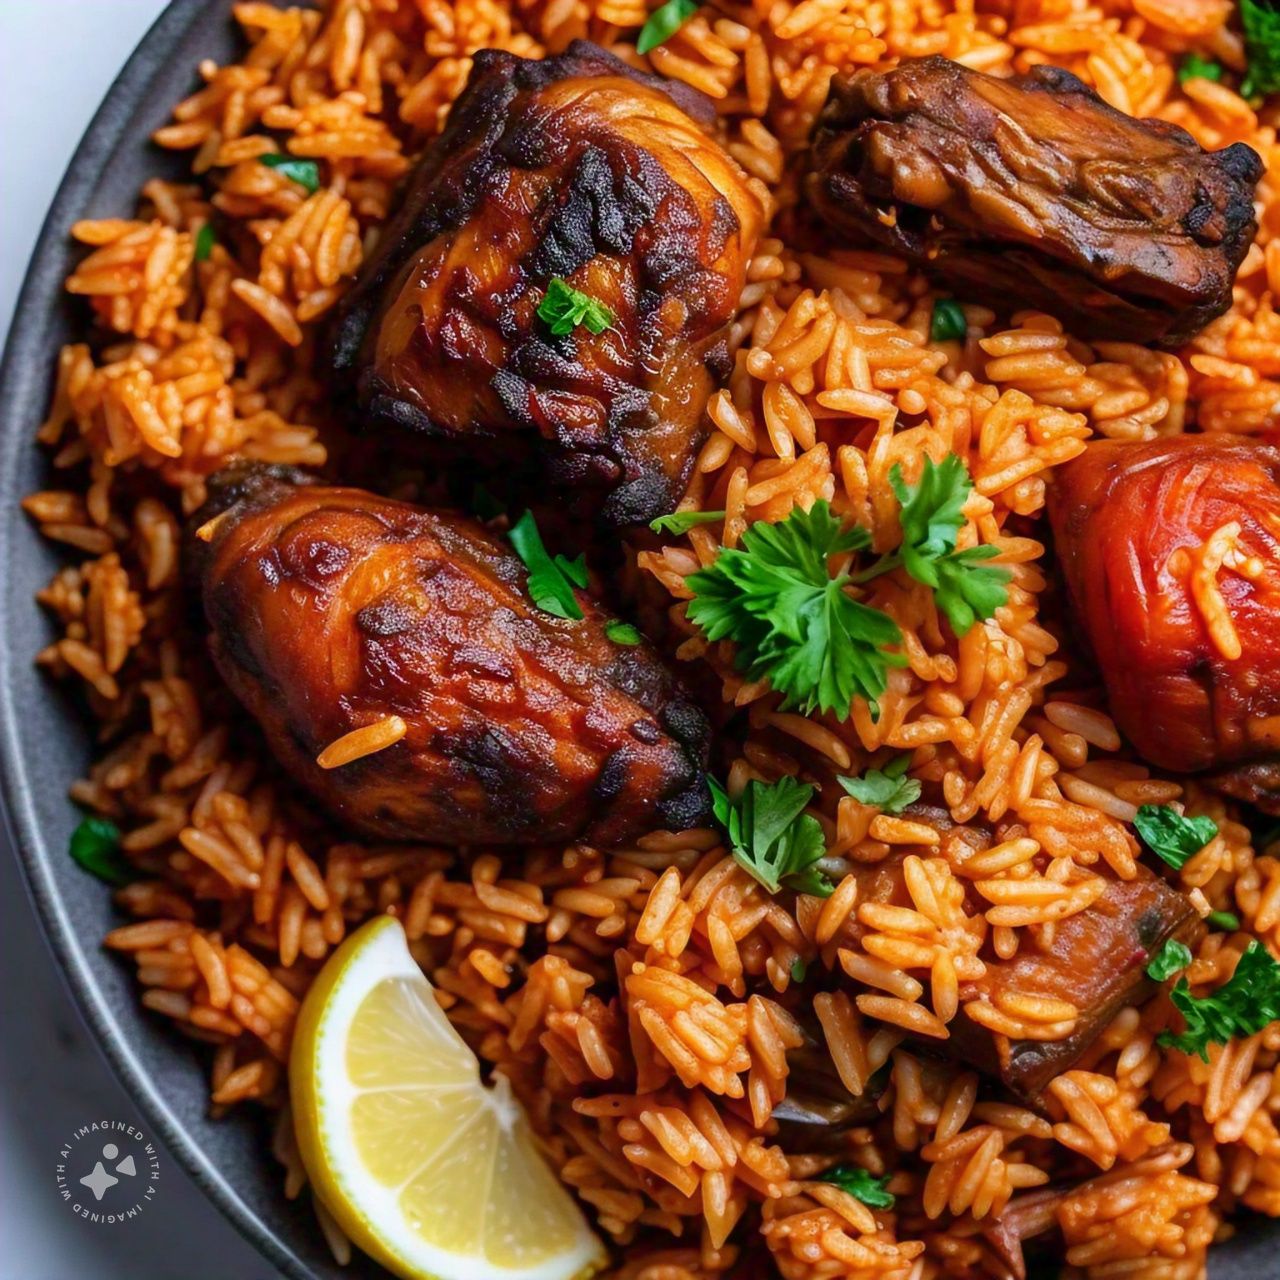
Jollof Rice
Jollof rice is a popular dish in West Africa, and the question of which country it belongs to is a topic of friendly debate! It's often celebrated as the national dish of several nations, such as Ghana, Senegal, Gambia, Sierra Leone, Liberia, and Nigeria. Each country has its distinct variation, but the fun rivalry known as the "Jollof Wars" between Ghana and Nigeria stands out, with both sides claiming their version is superior! This scrumptious one-pot dish is crafted from rice, tomatoes, onions, peppers, spices, and occasionally meat or fish.
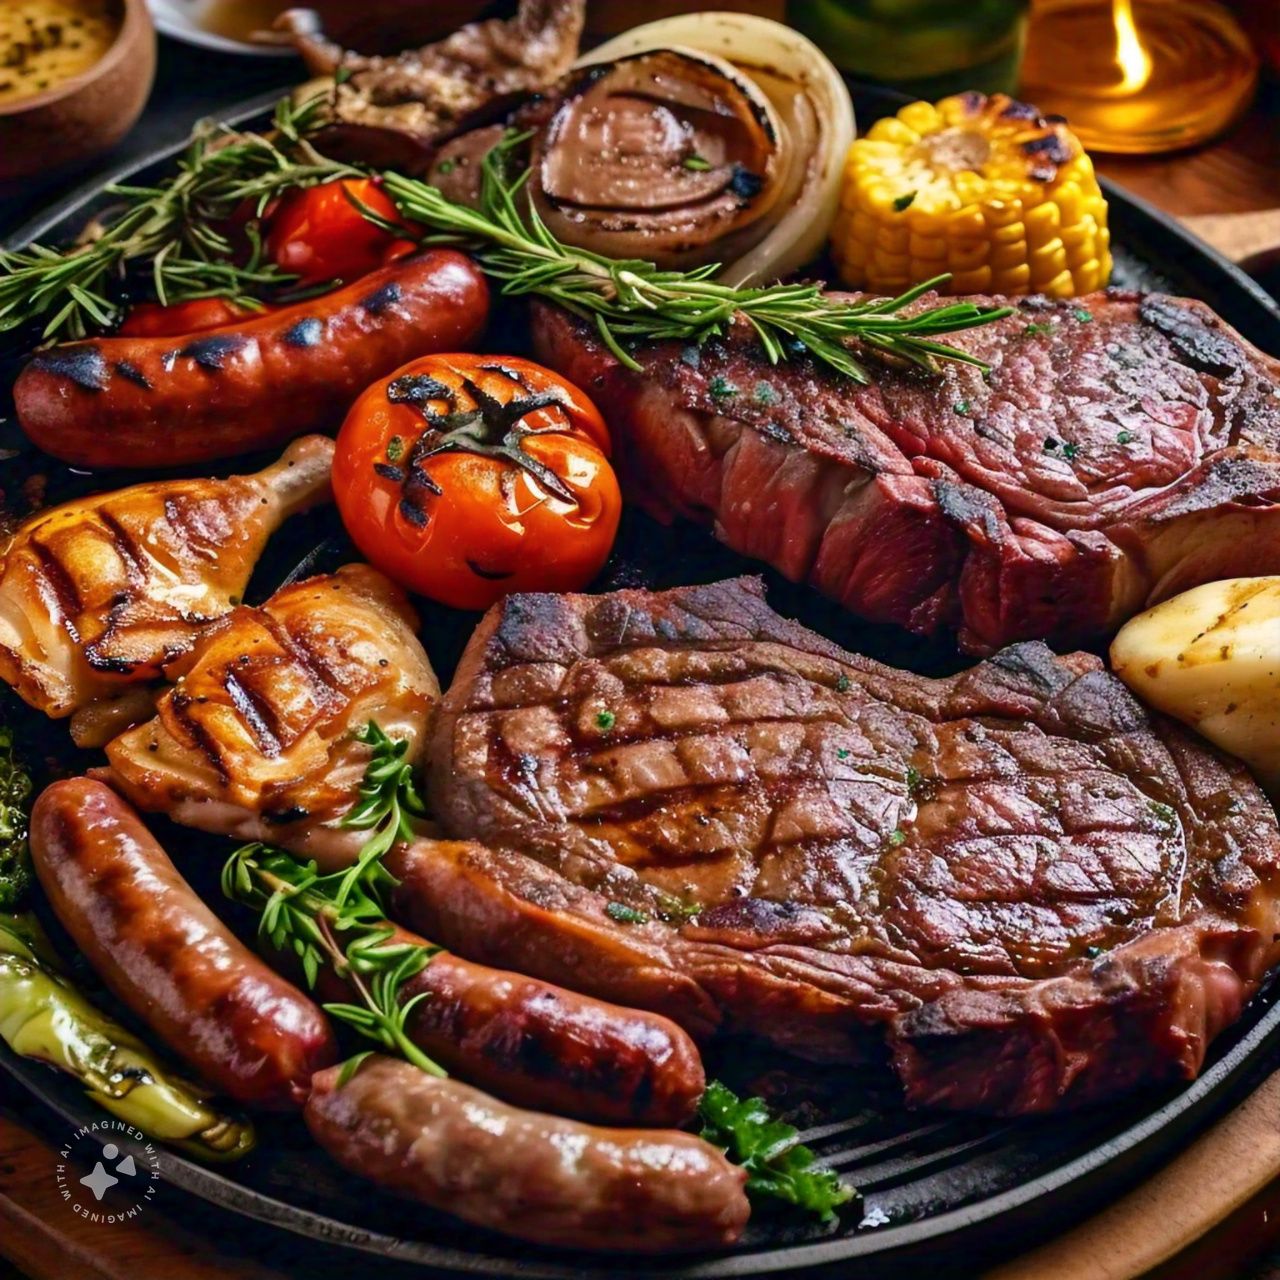
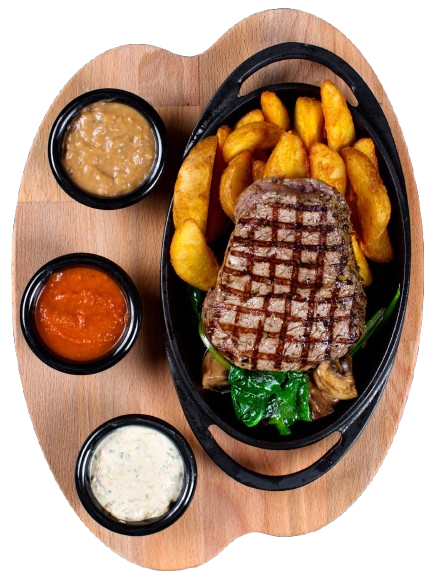
Asado
In South America, asado holds the title of national dish in several countries, notably Argentina, Uruguay, and Paraguay. This classic barbecue dish traces its origins back to the region's gauchos, or cowboys. Typically, it includes a selection of slow-cooked meats such as beef, pork, chorizo, and morcilla, grilled over an open flame and often enjoyed with chimichurri sauce, various sides, and wine.
Kokoda
Kokoda (also known as Raw Fish) is a traditional Fijian dish made from raw fish marinated in coconut milk, lime juice, onions, tomatoes, and chili peppers. The fish is typically cut into small pieces and mixed with the marinade, then served chilled or at room temperature.
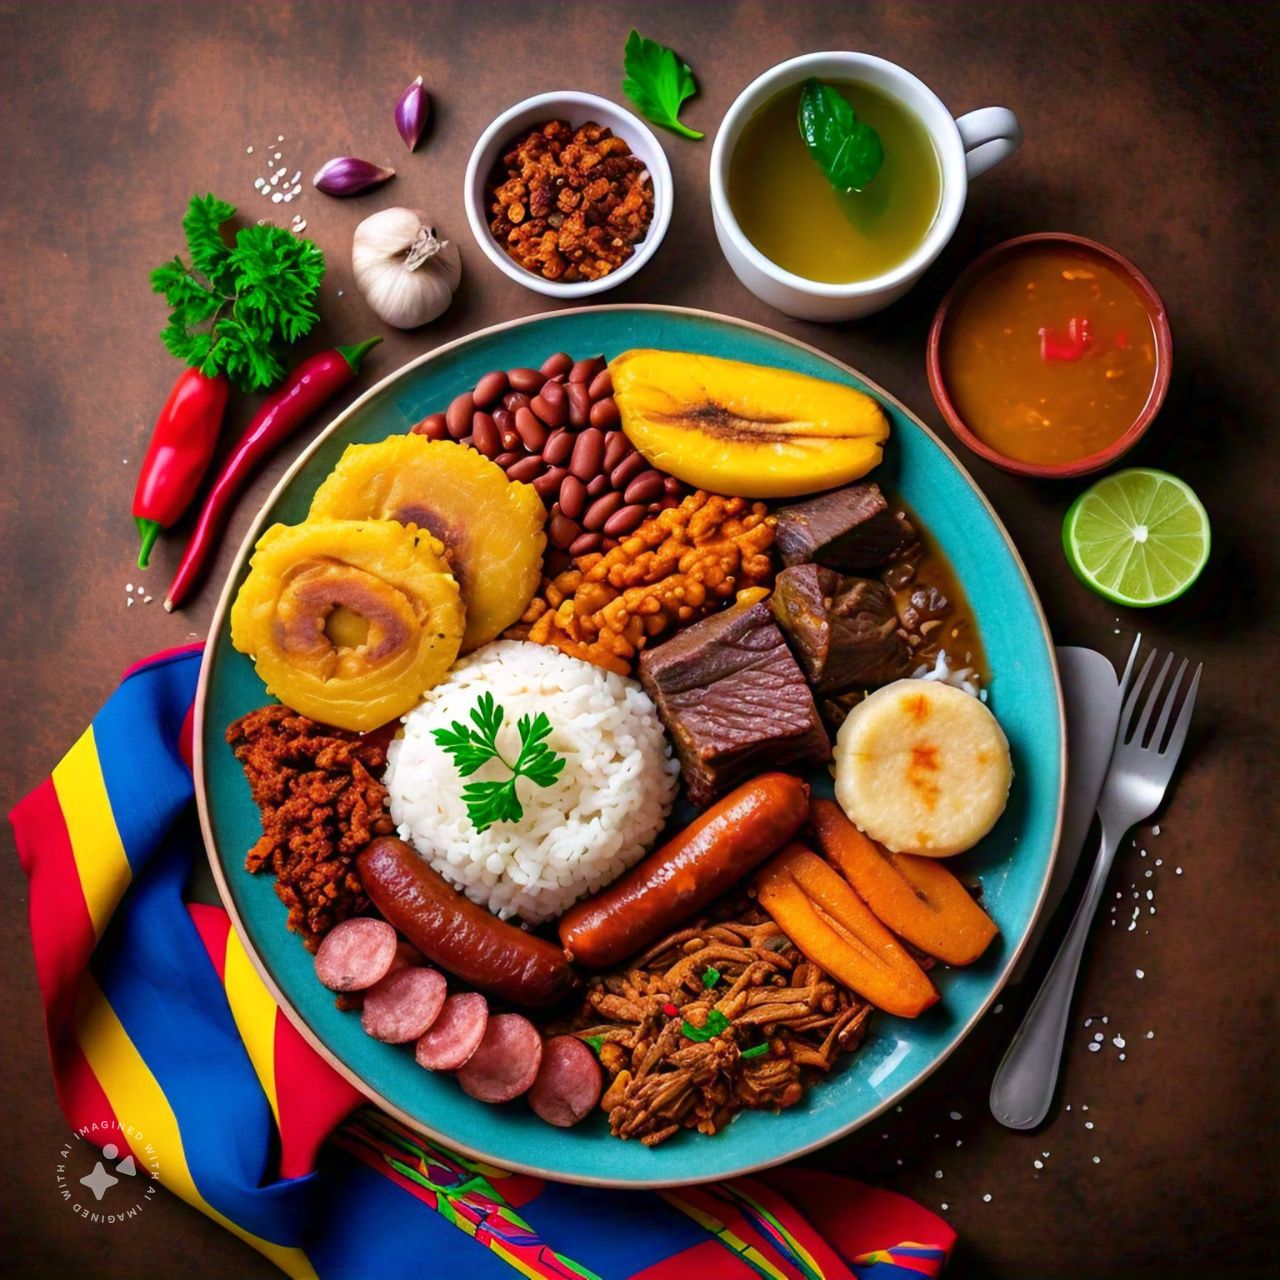
La bandeja-paisa
Known as the "Paisa Platter," La Bandeja Paisa is a traditional dish that originates from the Andean region of Colombia, particularly in Medellín and Pereira. This hearty meal is usually composed of rice, beans, ground beef, Colombian chorizo, a fried egg, plantain, avocado, arepa (cornmeal flatbread), and chicharrón (fried pork rinds). It showcases the vibrant culinary culture of Colombia and is commonly enjoyed in homes and eateries across the country.
Project Goals
-
Ensure that 90% of the project's audience easily understands two-thirds of the workflow.
-
Leave the audience curious and inspired to explore the stories, ingredients, and cultural significance behind national dishes.
-
Harness data to fuel debates on the age-old dispute regarding the life-span of white meat versus red meat consumers.
National Dish Project
The Project
Process
A quick summary of all the steps.

National Dish Project
Waterfall
Workflow
The project followed a step-by-step
approach where each step's success
influenced the next one.
Occasionally, updates were made
to enhance the project's quality.
Project Methodology
National Dish Project
Objectives
Defining what success meant was
a crucial step in the project. It
was essential to identify the tasks
at hand and their significance.
The ultimate goal was to explain the
entire data analysis workflow in a
way that would resonate with a
non-technical audience.


National Dish Project
Data
Collection
The data compiled was closely aligned
with the objectives. It featured the
national dishes from 200+ countries,
the ingredients involved, and human
lifespan details. A large part of this
information was sourced through web
scraping.
National Dish Project
Data
Cleaning
The gathered data was flawed and
could greatly affect the results'
accuracy. Issues included spelling
mistakes and inconsistent values.
Python was our tool of choice
for the cleaning process.


National Dish Project
Data
Modelling
The data resided in several tables,
and it was important to link them to
carry out the analysis.
MySQL Workbench was used to
create the relationship diagram and
develop the database.
Data
Visualization
Achieving clarity meant that the results had to be shown in a way that was simple to grasp, making visuals a necessity. Tableau was the chosen tool for generating these informative visuals.

National Dish Project
Thank
You !
Explore the project further
for a deep dive


National Dish Analysis Report

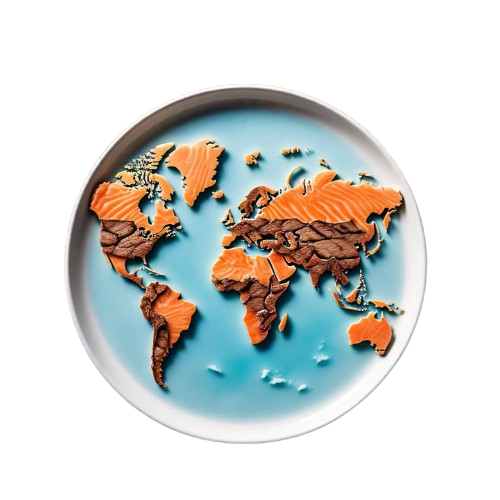

Table of Contents
- 1. Introduction
- 2. Significance Illustrations
- 3. What the Project Analysis Is About
- 4. The Global Ingredient Showdown: What National Dishes Have in Common
- A. Continental Ingredient Highlights
- B. Regional Ingredient Breakdown
- C. The Global Takeaway
- 5. Longevity Battle: Red Meat vs. White Meat – What the Data Really Shows
- A. Global Overview: A Tale of Two Meats
- I. Red Meat:
- II. White Meat:
- B. Meat Across Continents: Who’s Winning Where?
- I. Africa
- II. Asia
- III. Europe
- IV. Oceania
- V. North America
- VI. South America
- C. Key Findings
- 6. The Bigger Picture: It’s Not Just the Meat
- 7. Disclaimer
- 7. End of Report
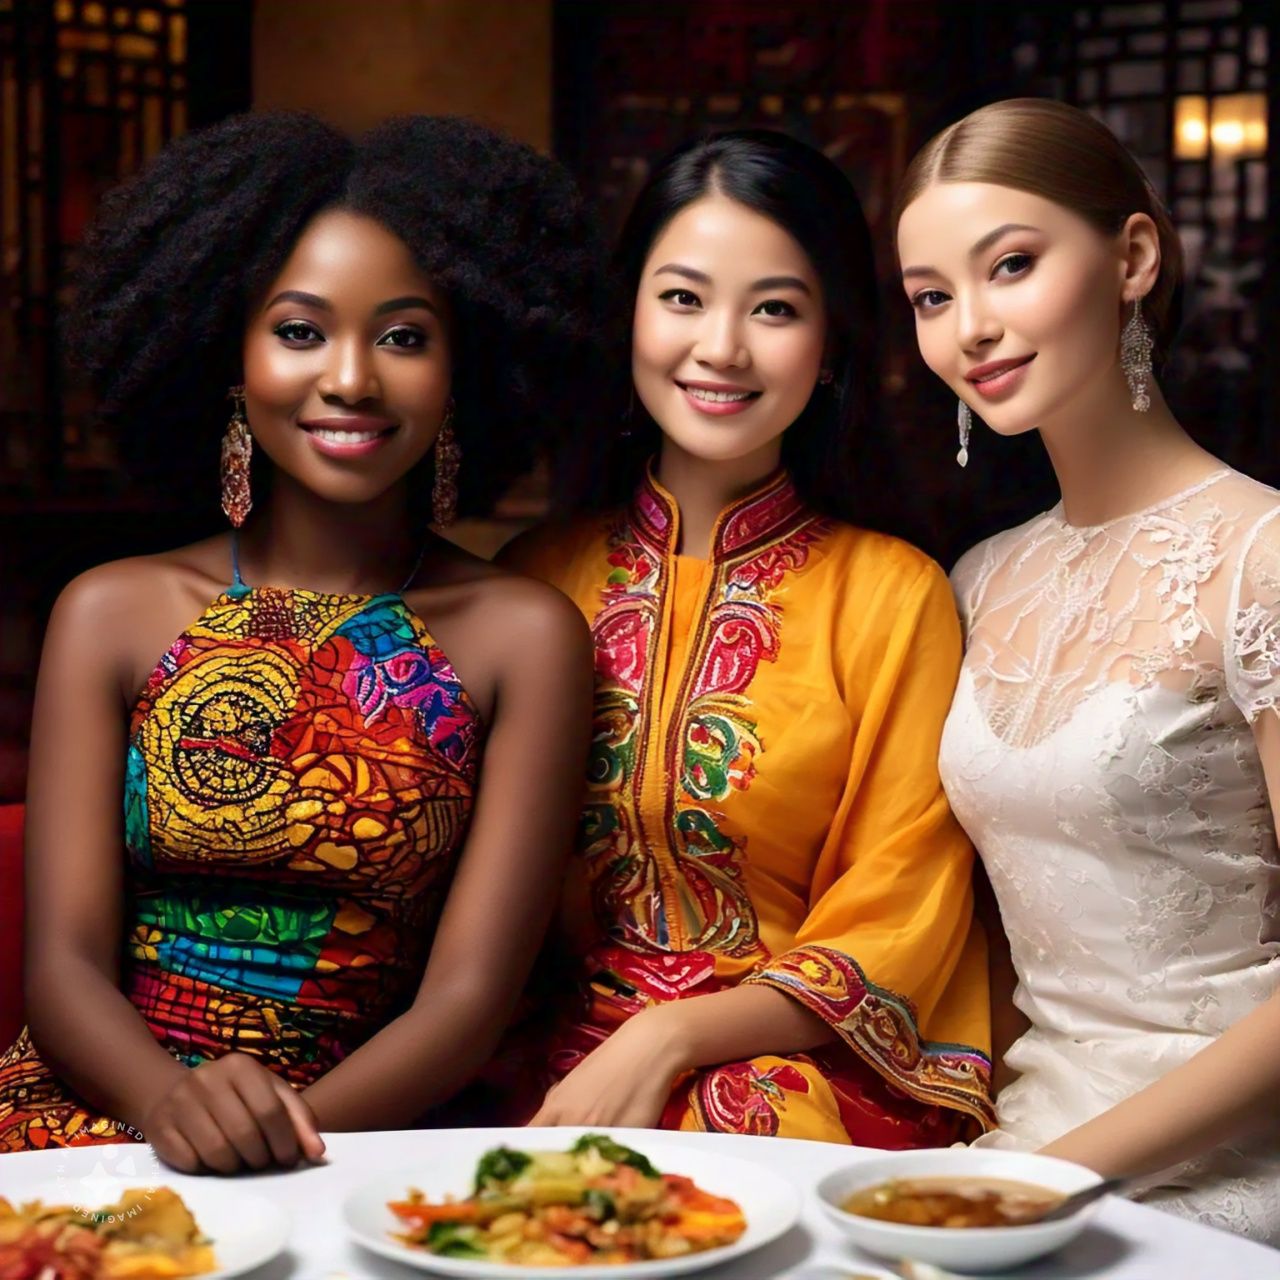
Food is engraved into our cultural identities. National dishes serve as the glue that binds people of different ethnic tribes and skin colors in a nation.
Significance Illustrations
The profound historical and cultural importance of national dishes is truly remarkable.

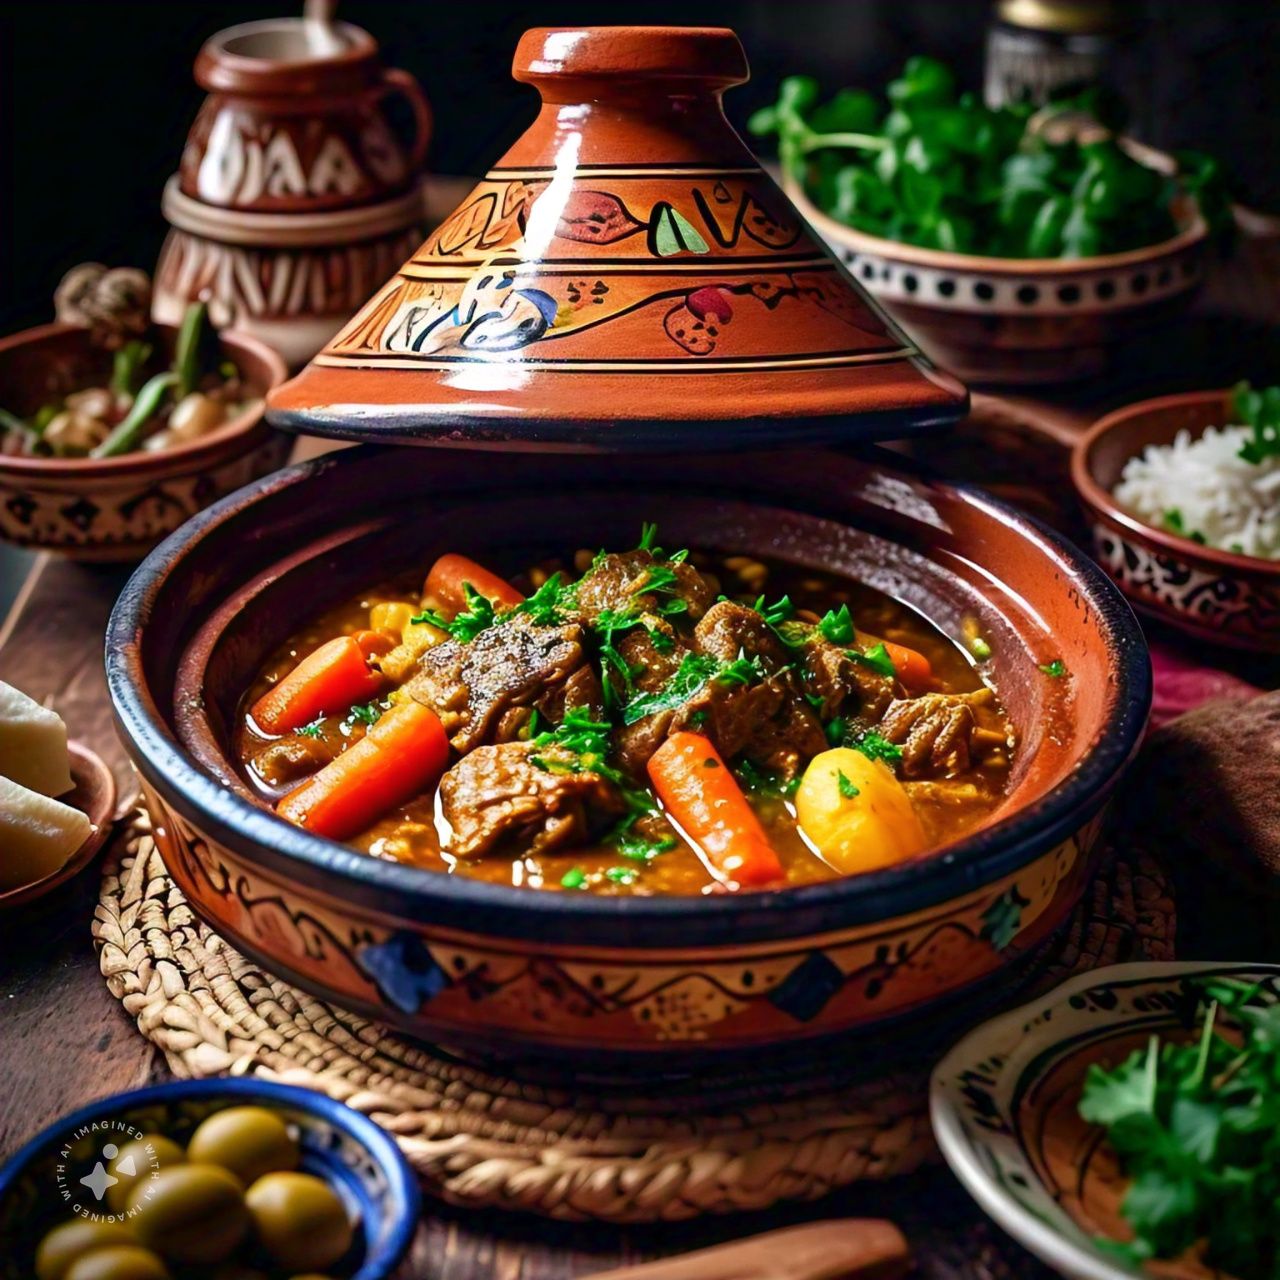
National Dish: Tagine.
In the rich tapestry of Moroccan courtship and engagement, it is not uncommon for families to have the future bride showcase her domestic talents by preparing traditional dishes for her suitor, a flavorful testament to her readiness for marriage.
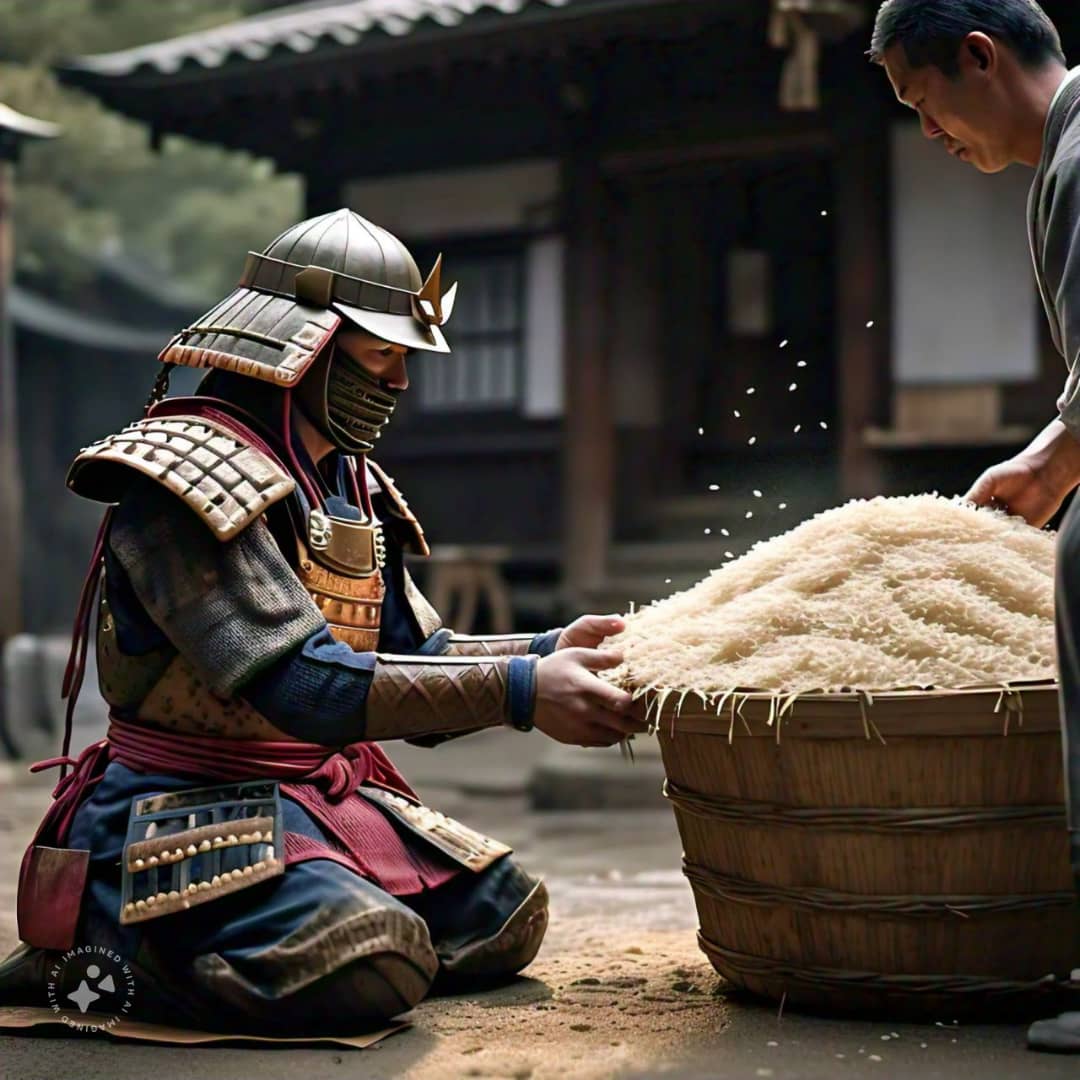
National Dish: Curry Rice.
In Japan, Samurai were paid in rice, which was seen as a symbol of wealth and status.
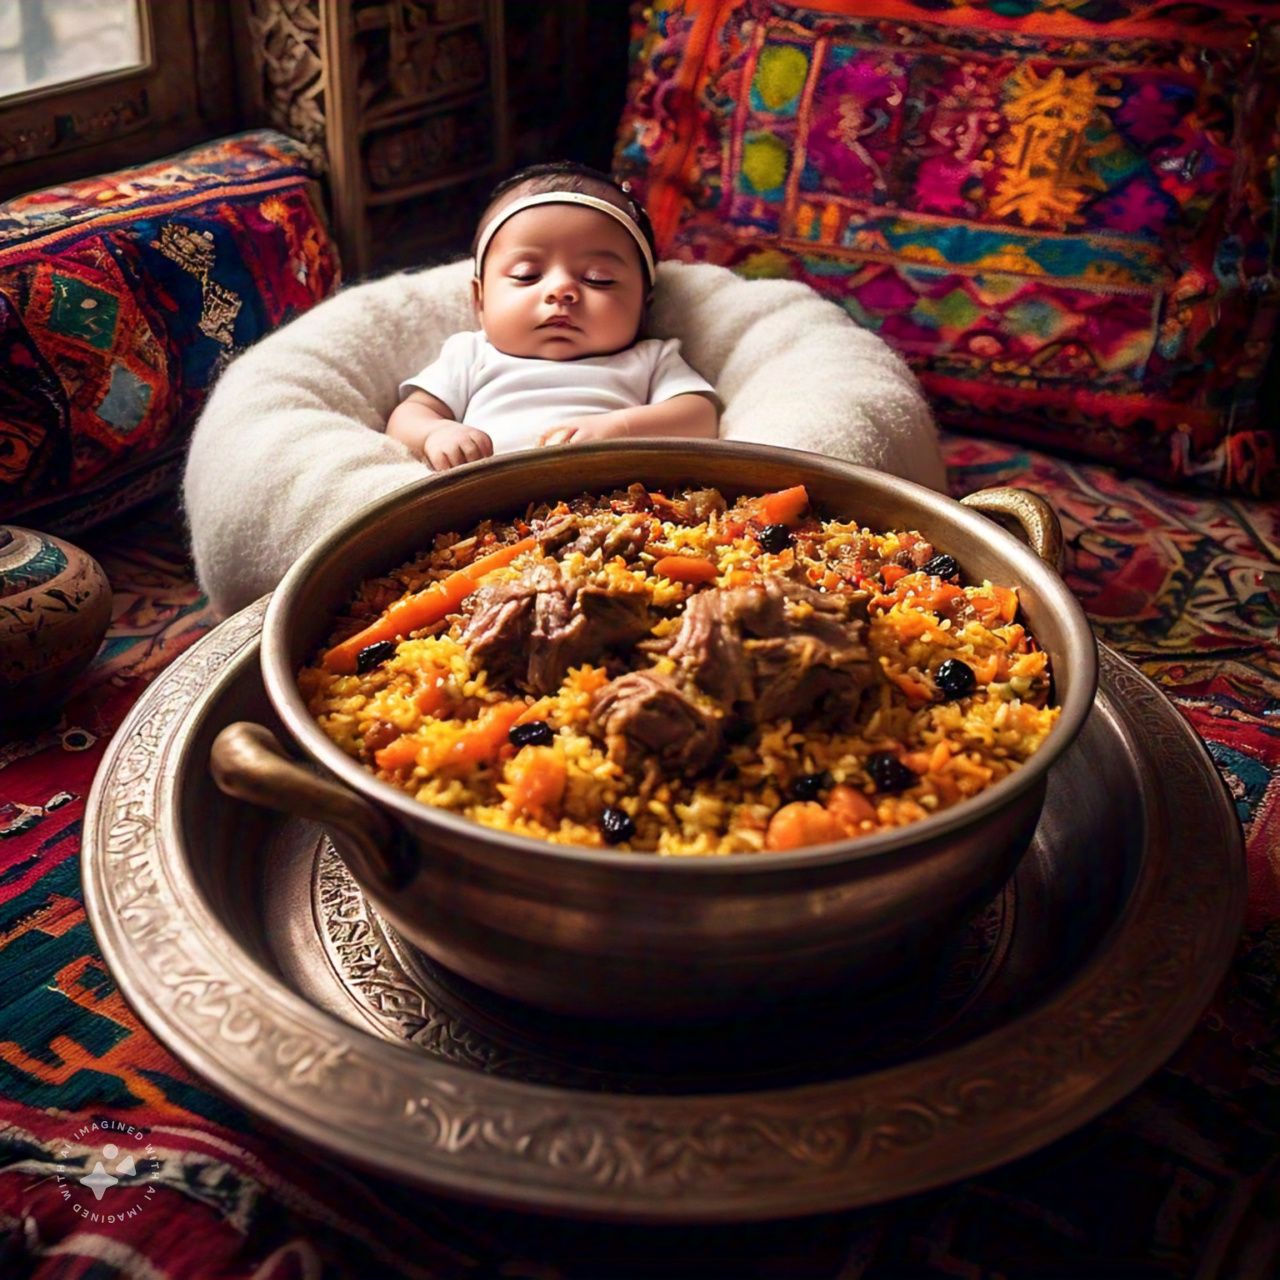
National Dish: Qabili Palaw.
Seven days post-birth, Afghanistan comes alive with the Aqiqah celebration, a heartfelt tribute to a new life. The ceremony features the shaving of the baby's hair and the joyful announcement of their name. Guests indulge in the rich flavors of Qabili Palaw, a beloved dish that adds to the festive atmosphere.
What the project analysis is about…
This project utilizes data analysis to celebrate national cuisines. It focuses on ingredients popular in national dishes and how the meat type incorporated influences life expectancy. Comparing white meat and red meat-based cuisines, it explores potential links between meat type and longer life expectancies.
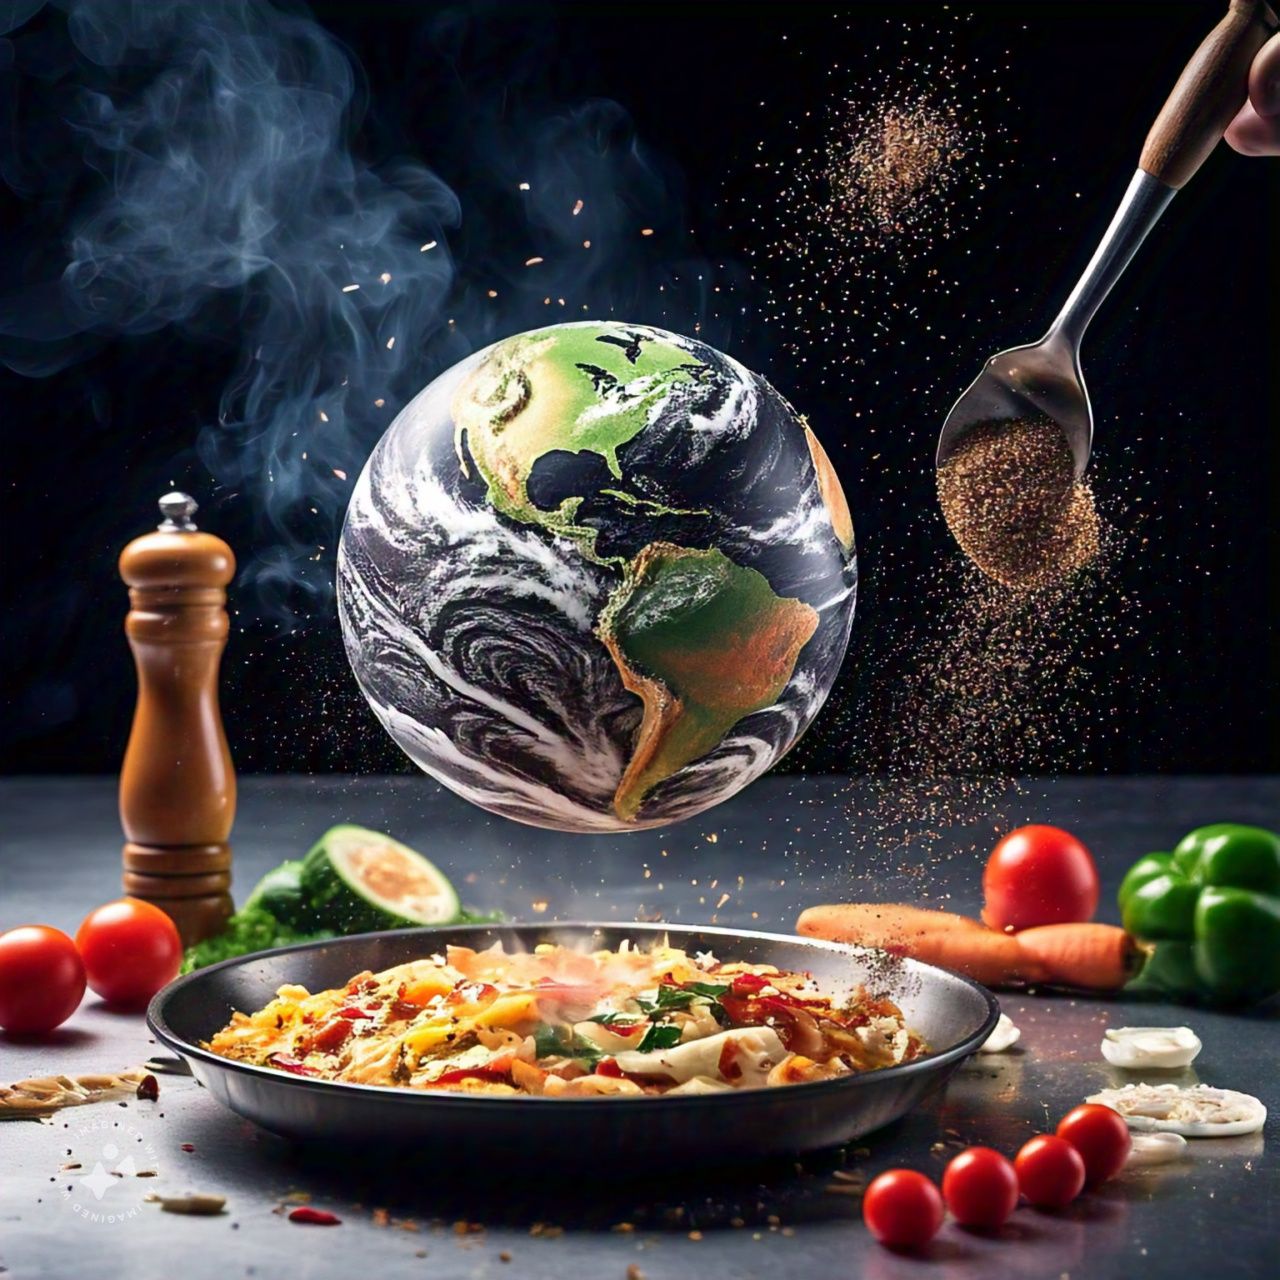
The Global Ingredient Showdown
What National Dishes Have in Common
In a world often divided by borders and cultures, one universal truth transcends all nations: food. And not just any food—national dishes. Every country has that one iconic meal that defines its culinary identity. But amidst the rich diversity of flavors and traditions, we decided to ask a burning question: are there any common ingredients that unite these national dishes around the globe?
We went on a global ingredient hunt to uncover what’s common in the national dishes of countries worldwide. Some ingredients are not just food; it’s comfort. It’s comfort food, in capital letters. These ingredients unite the world in the kitchen, whether flipping a burger in the U.S., stirring a pot of curry in India, or grilling a steak in Argentina.

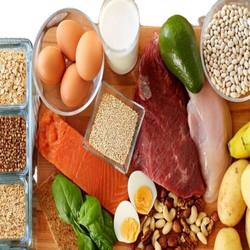
Meat serves as an umbrella term for most red meats such buffalo meat, goat meat, lamb, etc.
Continental Ingredient Highlights
But before you imagine that every country’s dish is a simple stew with rice and meat, here’s where it gets interesting: while these ingredients are found across borders, each region has its own twist. Let’s see how different continents spice things up:
Regional Ingredient Breakdown
Now, let’s take a closer look at the regional specialties that define the national dishes of each area:
Region's Top Ingredient
Africa
Eastern Africa
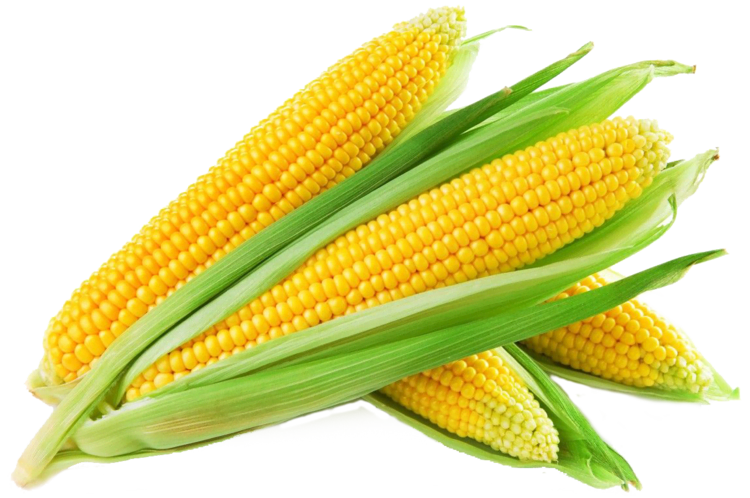
Maize (14.71%)
Middle Africa
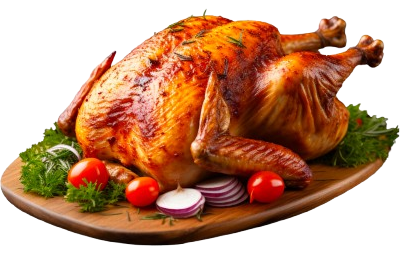
Chicken (13.16%)
Northern Africa
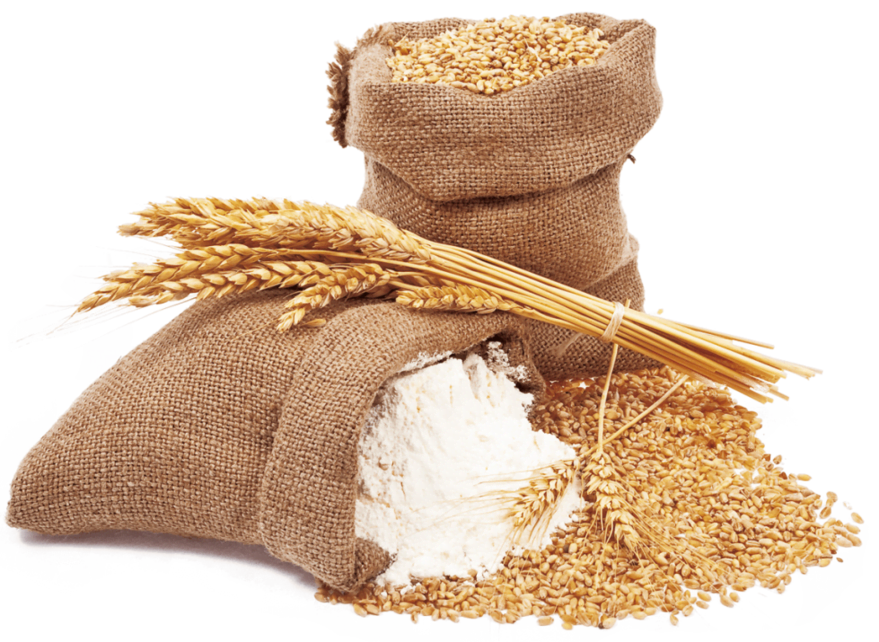
Flour (9.38%)
Southern Africa
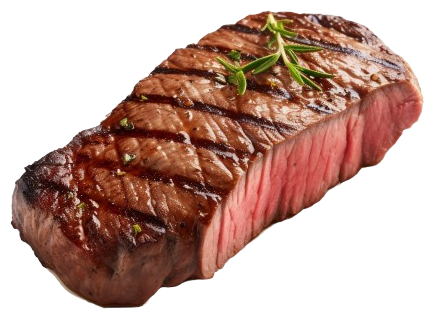
Meat (20.00%)
Western Africa
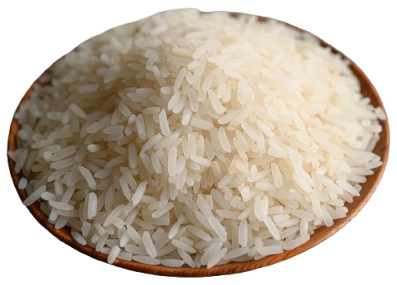
Rice (10.81%)
Asia
Central Asia
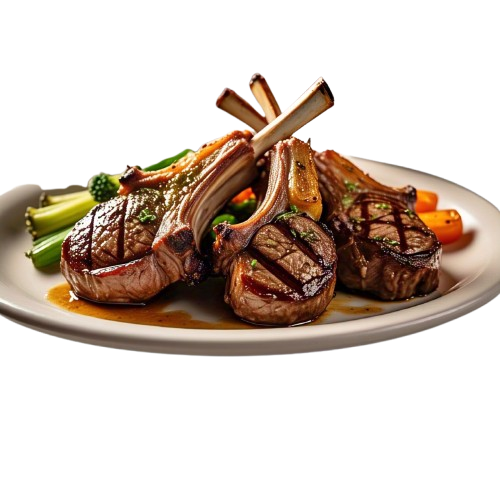
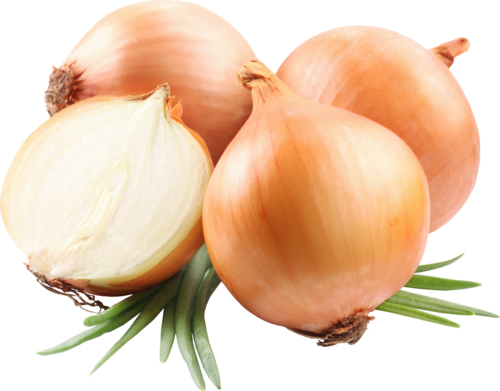
Lamb, Onion – Tied for first place at 16.67%
Eastern Asia
Beef (18.75%)
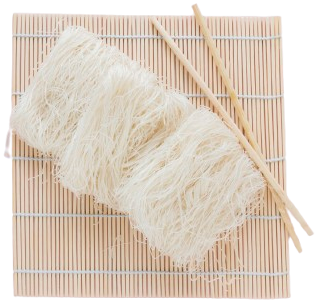
Southeastern Asia
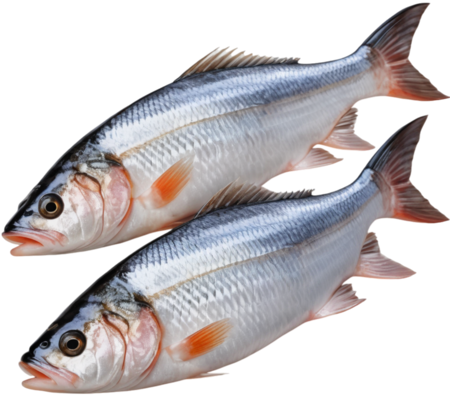
Fish, Rice, Rice Noodles – Tied for first place at 16.67%
Southern Asia
Rice (26.09%)
Western Asia
Rice (18.42%)
Europe
Eastern Europe
Meat (11.11%)
Northern Europe
Beef, Lamb – Tied for first place at 9.68%
Southern Europe
Flour, Meat – Tied for first place at 11.54%
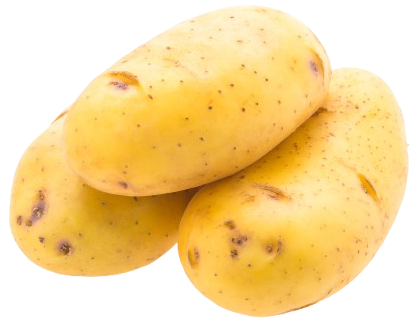
Western Europe
Potatoes (18.75%)
North America
Caribbean
Fish (10.53%)
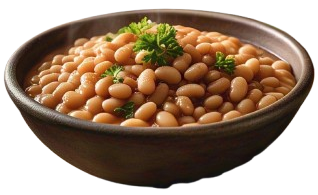
Central America
Beans (21.05%)
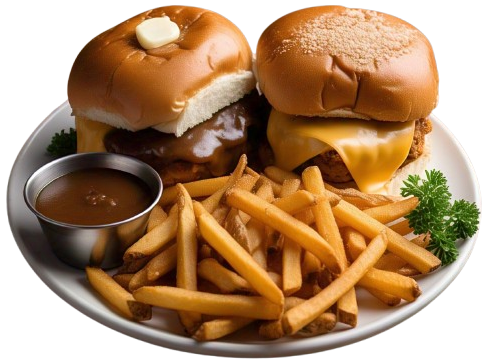
Northern America
Buns, Cheese, French Fries, Gravy – Tied for first place at 25%
Oceania

Australia and New Zealand
Castor Sugar, Eggs, Flour, Meat – Tied for first place at 25%
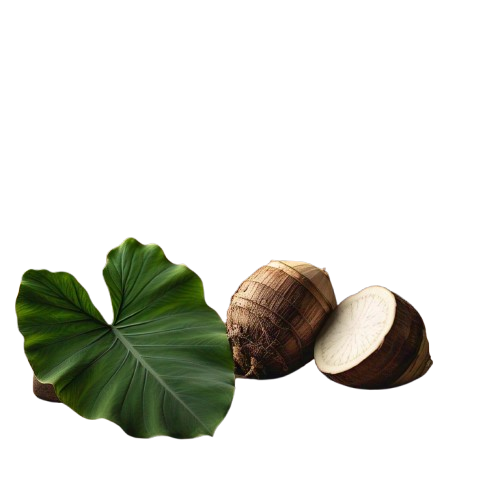
Melanesia
Taro (15.79%)

Micronesia
Coconut (18.75%)
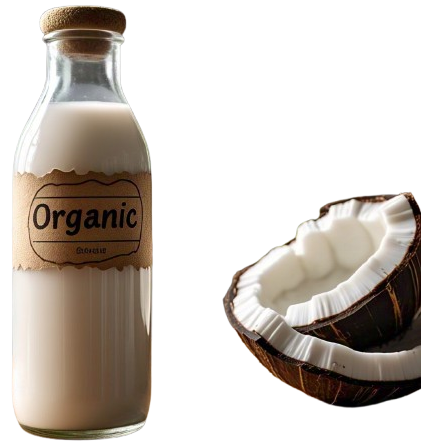
Polynesia
Coconut Milk (13.33%)
South America
South America: Beef (12.24%)
The
Global Takeaway
Here’s the kicker: while many of these ingredients are well-known globally, the national dishes they define are vastly different. Whether it’s beef in Argentina’s Asado, rice in China’s fried rice, or coconut in Polynesia’s curry, each dish tells the story of a culture, a country, and a people. So while we may all eat rice, the way it’s prepared, served, and celebrated is what makes it uniquely our own.
So next time you're sitting down to enjoy a national dish—whether it's a steaming bowl of rice,
a succulent chicken stew, or a juicy beef burger—remember:
these ingredients connect us in ways we might not have expected.
Who knew that something as simple as onion could be part of a global peace treaty…
one bite at a time.
And just like that, food becomes the great unifier—bringing together nations, continents, and even those who argue over whether pizza is a breakfast food.
We all know it's a breakfast food :)

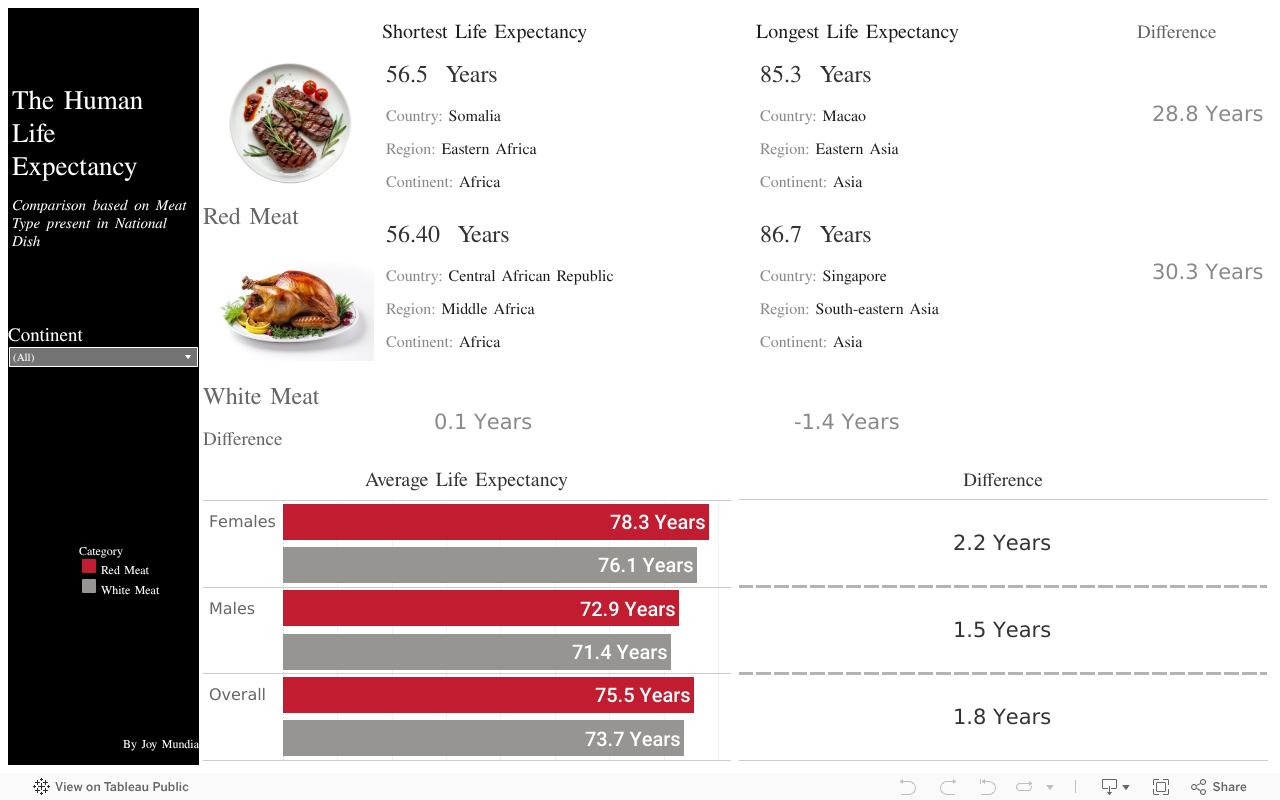
Longevity Battle: Red Meat vs. White Meat
What the Data Really Shows

- In the realm of meat consumption and its effects on life expectancy, it’s easy to categorize red meat as the foe and white meat as the friend. However, as we unravel the complexities, we realize that the story is far from black and white.
Global Overview
A Tale of Two Meats
Red Meat
- Shortest Life Expectancy: Somalia – 56.5 years. Red meat doesn’t seem to be the key to longevity here.
- Longest Life Expectancy: Macao – 85.3 years. Maybe Red Meat might be the key to a long life…
White Meat
- Shortest Life Expectancy: Central African Republic - 56.4 years. A small difference, but red meat still keeps the lead.
- Longest Life Expectancy: Singapore - 86.7 years. White meat’s star performer, just barely ahead of red meat.
- Surprisingly, the gap between red meat and white meat’s top performers is just 1.4 years. A small difference, yet it’s a difference that makes us rethink how we look at diet and longevity.
Meat Across Continents:
Who’s Winning Where?
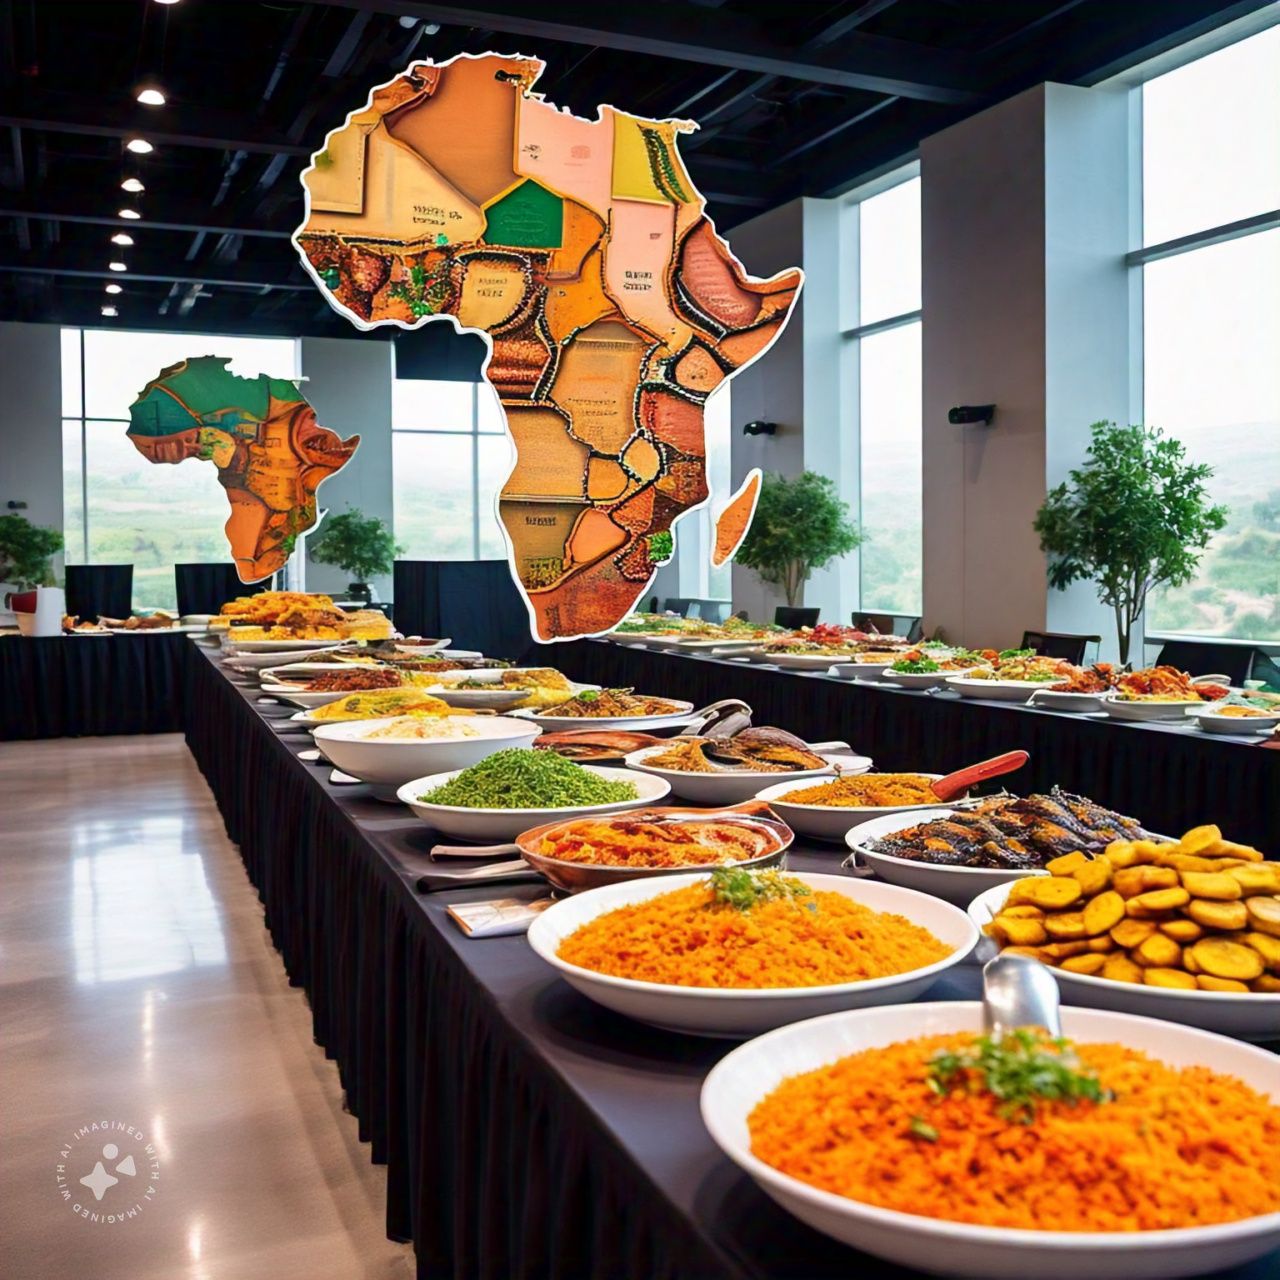
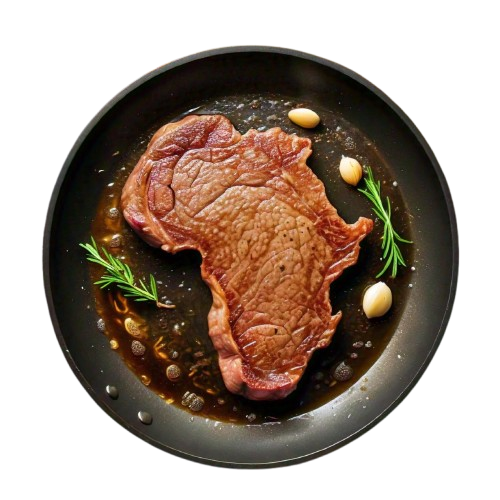
Africa
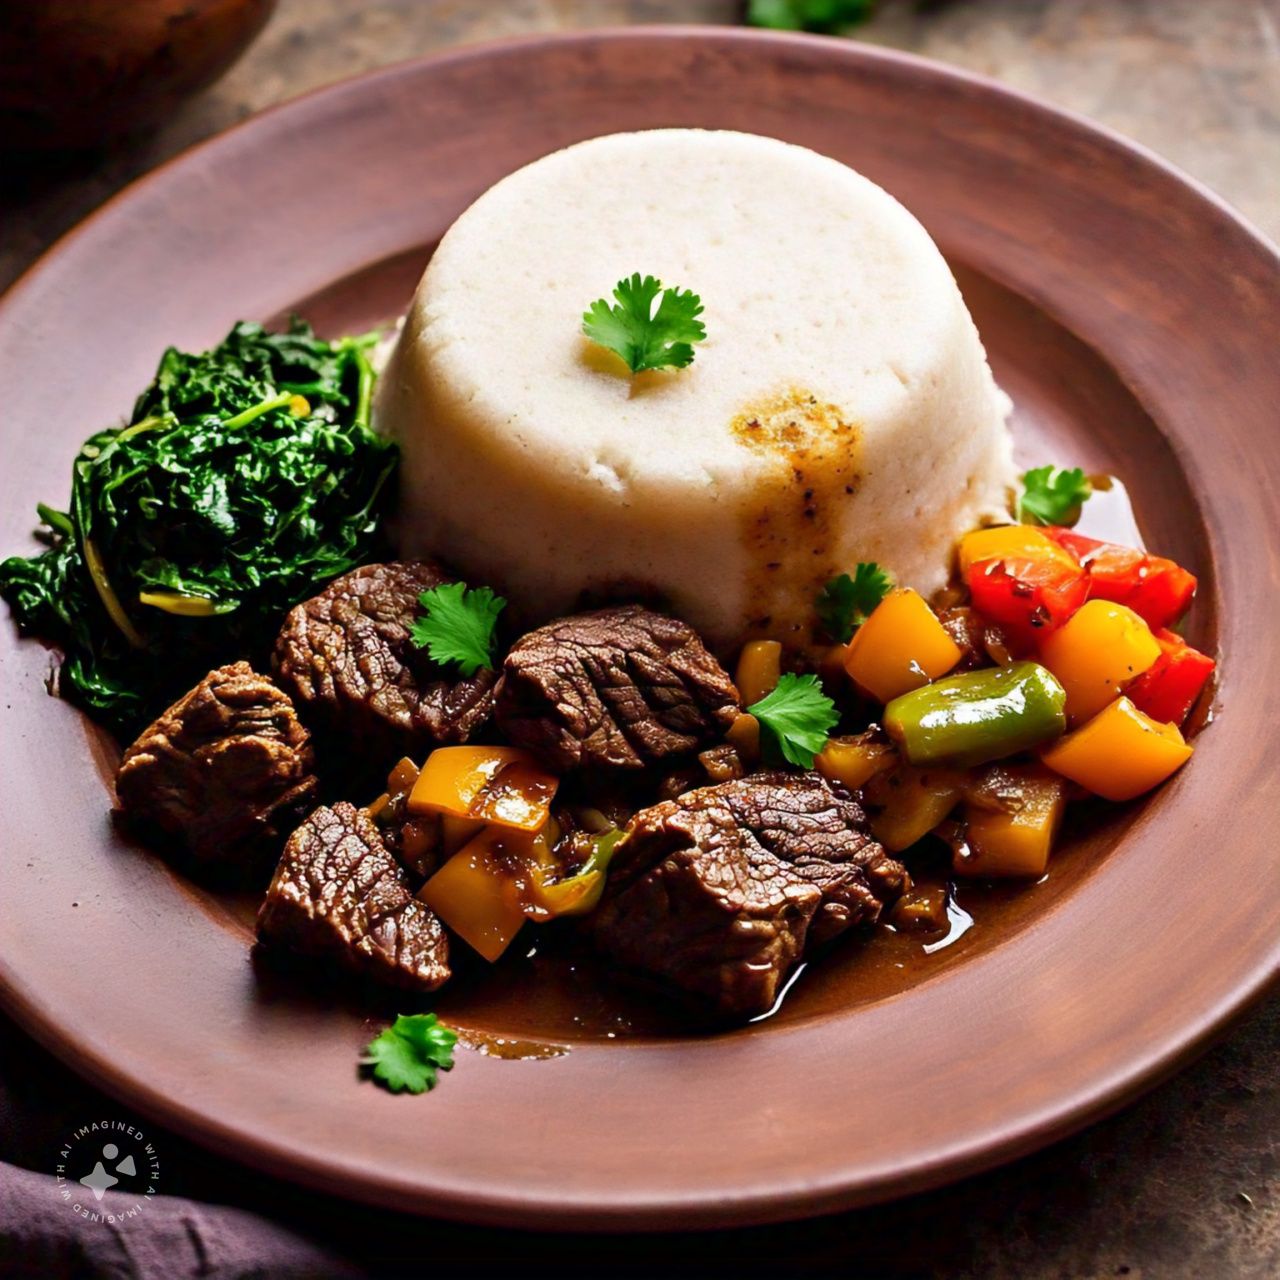
The African continent shows a tight race between red and white meat.
In Libya, red meat holds a slight edge (77.7 years) over white meat in Seychelles (76.6 years).
However, the overall life expectancy across Africa remains on the lower side, regardless of meat choice.
And, interestingly, the gender gap in life expectancy is minimal—only 0.2 years between red and white meat eaters.
Dish in Image: Ugali
Country: Uganda
Asia
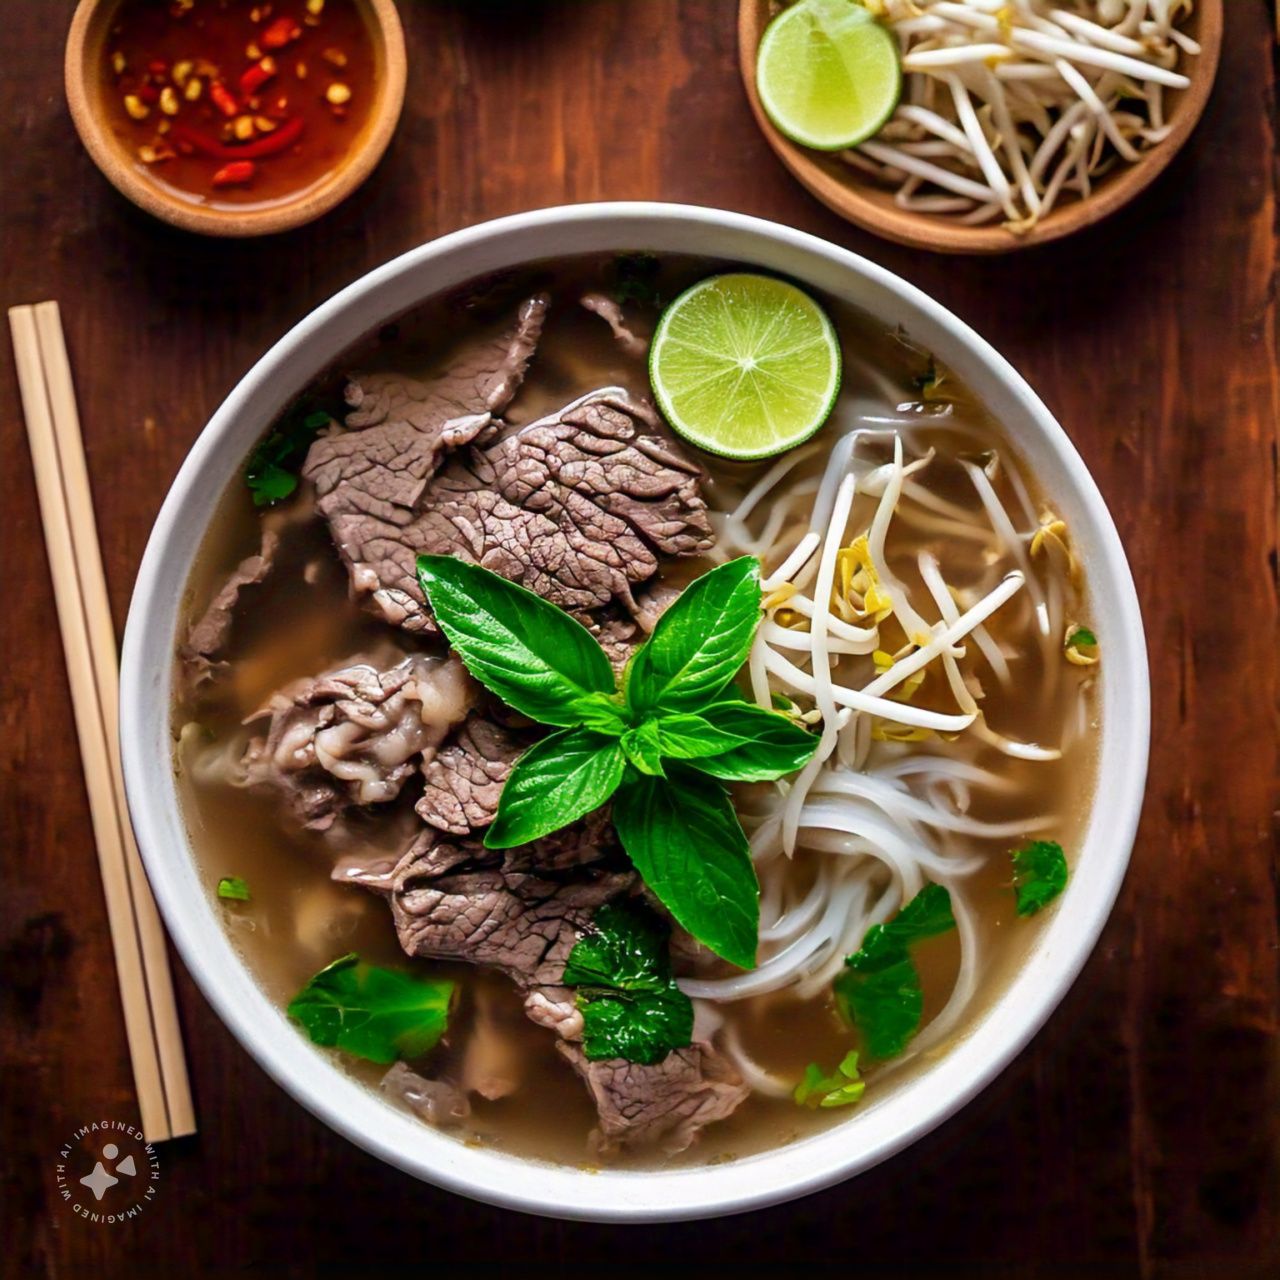
Here, things get really interesting.
Macao, known for red meat, tops the chart at 85.3 years,
while Singapore, with its white meat-heavy diet, leads at 86.7 years.
The difference? A mere 1.4 years.
Women show a slight edge for red meat (78.5 years vs. 78.3 years for white),
but men live a bit longer with white meat (73.9 years vs. 73.3 years for red).
It’s a cliffhanger, but ultimately, both meat types are neck and neck.
Dish in Image: Pho
Country: Vietnam

Europe
Europe offers an interesting dynamic:
for women, white meat delivers a solid 84.5 years,
while red meat reaches 82.4 years. But for men?
Red meat takes the lead with 79.4 years,
compared to 76.2 years for white meat.
This creates a curious split where men and women are influenced by different dietary choices.
The result? Red meat ends up with a slight edge overall by 3 years.
Yet, the real intrigue here isn’t the meat itself,
but how gender preferences and lifestyle choices intersect with diet in shaping these outcomes.
Dish in Image: Draniki
Country: Belarus

North America
Here, red meat wins by a small margin of 2.9 years overall.
But here’s the kicker:
men show a 3.3-year advantage for white meat,
while women live 2.5 years longer on white meat as well.
The real question here is what else is influencing these outcomes—exercise,
access to healthcare, or perhaps even the fast food culture?
Dish in Image: Burger
Country: USA
Oceania
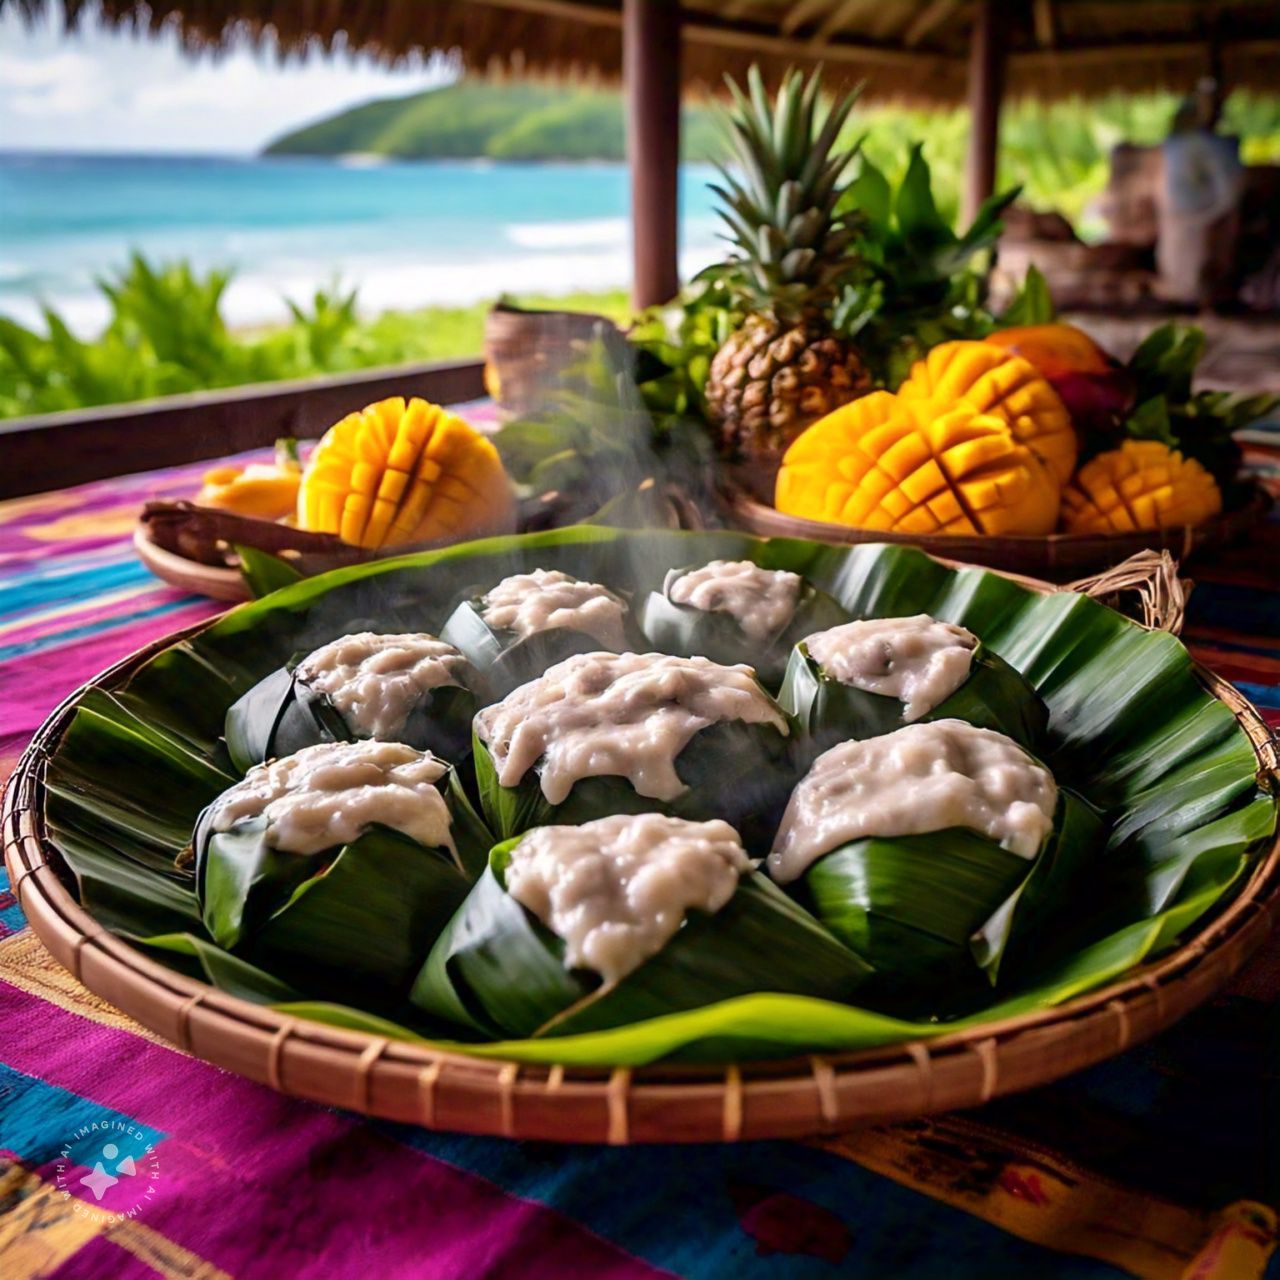
Australia takes the crown here,
with red meat dominating the life expectancy game at 83.5 years,
leaving white meat countries like French Polynesia (78.9 years) and Fiji (74.8 years) trailing behind.
Women in Australia enjoy the longest life expectancy (85.7 years) with red meat—who knew meat could have such an impact?
Dish in Image: Laplap
Country: Vanuatu
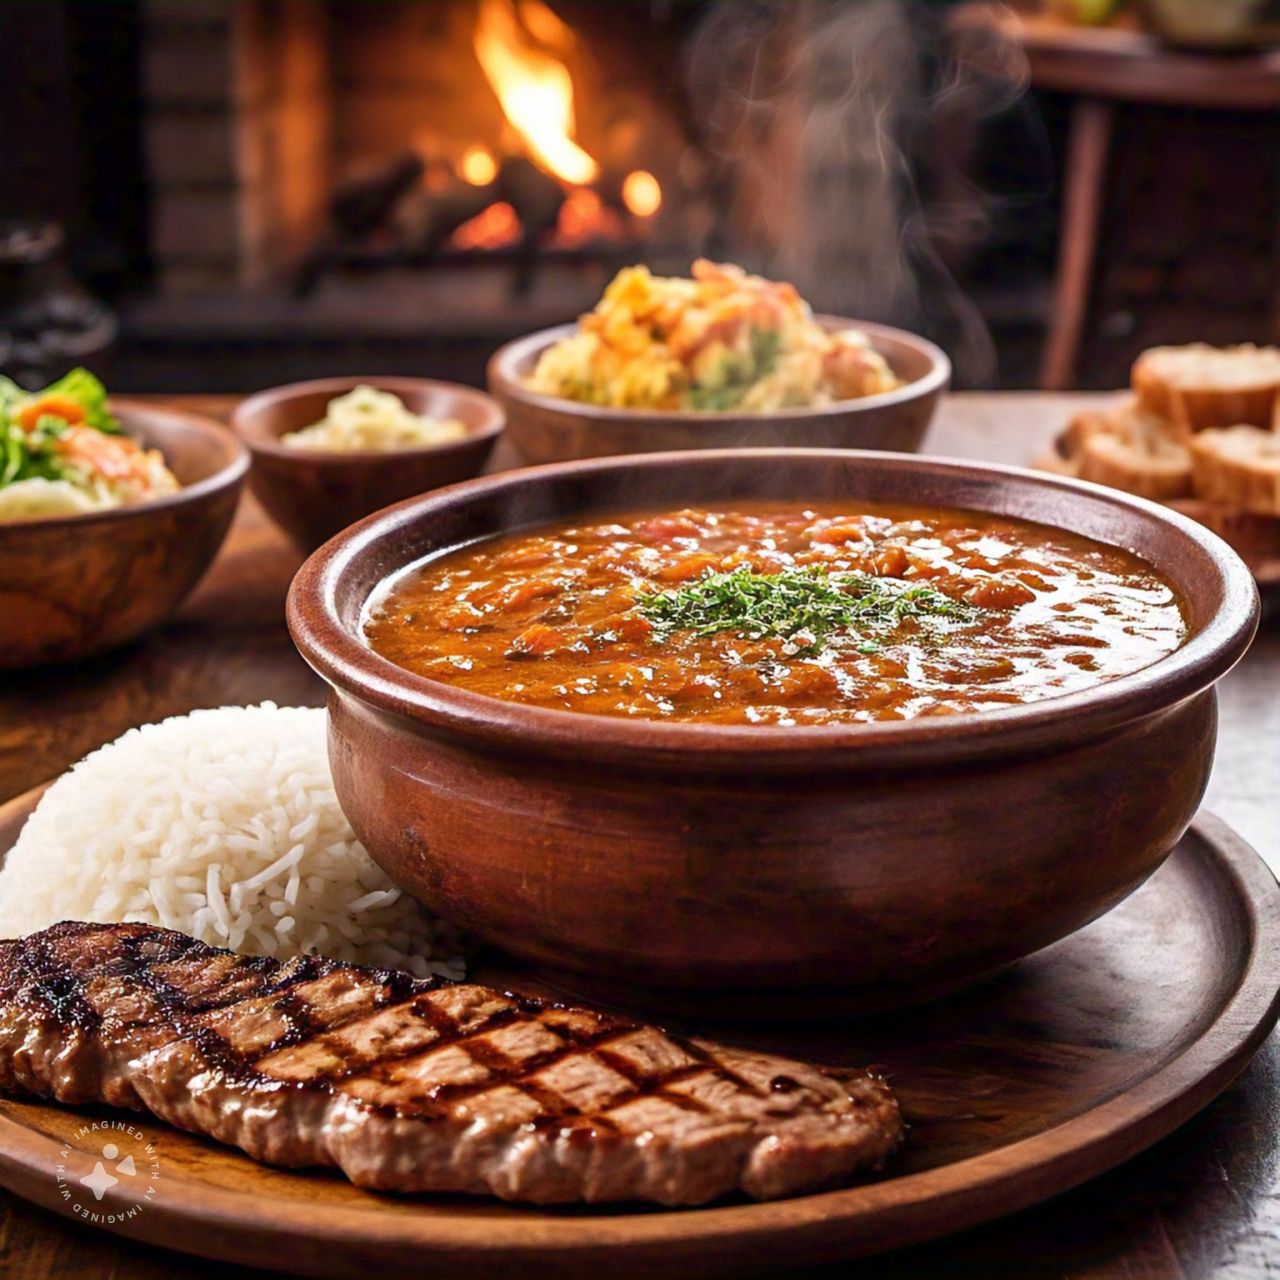
South America
In South America, red meat eaters have a slight edge in life expectancy,
averaging 72.2 years compared to 76.3 years for white meat eaters.
On average, women who eat red meat live 2.8 years longer than those who eat white meat,
while men live 5.3 years longer.
The overall life expectancy difference between red and white meat eaters is 4.1 years.
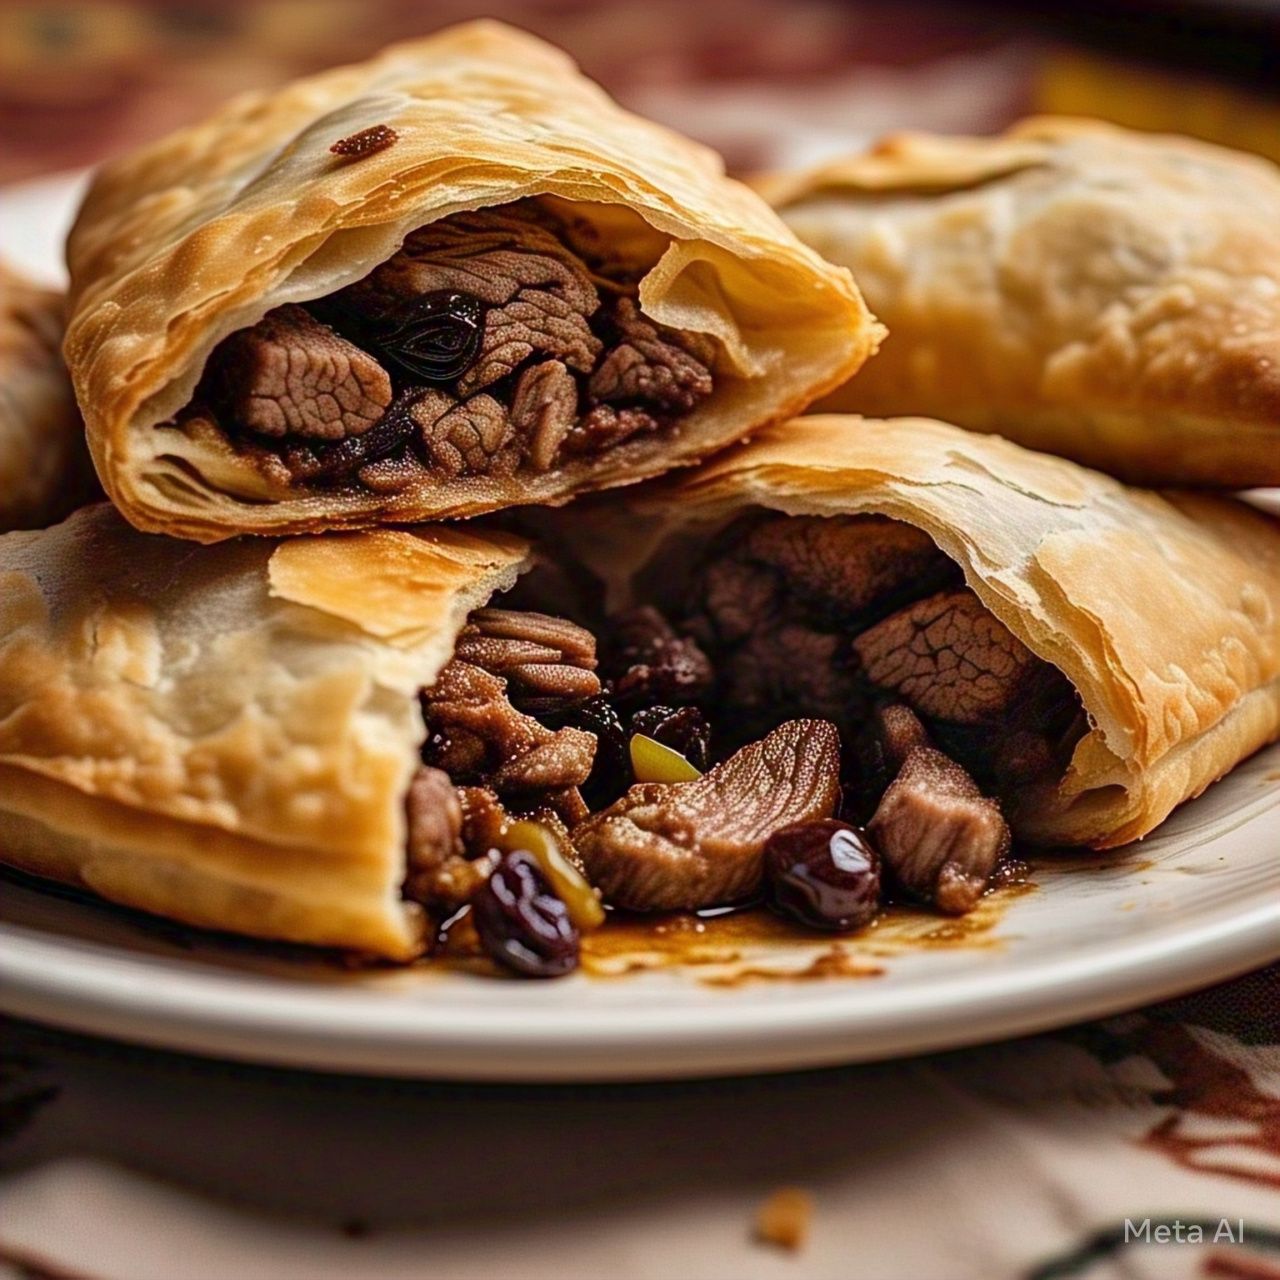
Dish in Image: Salteñas
Country: Bolivia
Key Findings
Red Meat Triumphs in Oceania:
Especially among women in Australia, where it holds a significant edge.
White Meat Prevails for Women in Europe :
However, red meat still comes out ahead for men.
Asia is a Virtual Draw:
With minimal differences between red and white meat, the life expectancy gap is razor-thin.
Africa Keeps It Close:
With both red and white meat showing similar life expectancy outcomes,
Africa remains a bit of a mystery, with low overall life expectancy across the board.
The Gender Factor:
Across many regions, women tend to live a little longer on white meat,
while men see a slight boost with red meat. It’s almost like a global dietary dance.

The Bigger Picture
It’s Not Just the Meat


While the debate between red and white meat is fun to follow, it’s important to remember that life expectancy is shaped by far more than just what’s on our plates. Factors like healthcare access, socio-economic status, lifestyle, and even genetics play a huge role in how long we live. So, before you ditch your national dish in pursuit of a new culinary trend that seems to promise a longer life, remember that food is just a single component of a much larger health landscape.

Will you indulge in the sumptuous taste of red meat, the refined essence of white meat, or a delightful fusion of both? Whatever your selection, ensure it aligns with a lifestyle that fosters wellness and extends your years.
Disclaimer
To comply with the project's guidelines, only ONE national dish was taken into account. Nevertheless, for numerous countries, there is no singular dish that is firmly established as the national dish.
Due to recipe variations, analysis results may differ based on the ingredients incorporated.
Certain images may not be accurate as they were Ai generated.
Thank You
SQL QUERIES

Data Collection

Web Scraping Using Excel
Web Scraping Using Excel
For data already structured in tables on the web such as the Country_region data, the following formula was used:
=IMPORTHTML("Website URL","table", table_number_on_webpage)

Web Scraping Using Python
Web Scraping Using Python

Nothing fancy
Nothing fancy
The retrieval of certain data relied on the tried-and-true method of 'Copy and Paste'. This was particularly true for the main ingredients of various national dishes, as their recipe variations demanded manual entry and human judgment.

Data Cleaning
Data Modelling
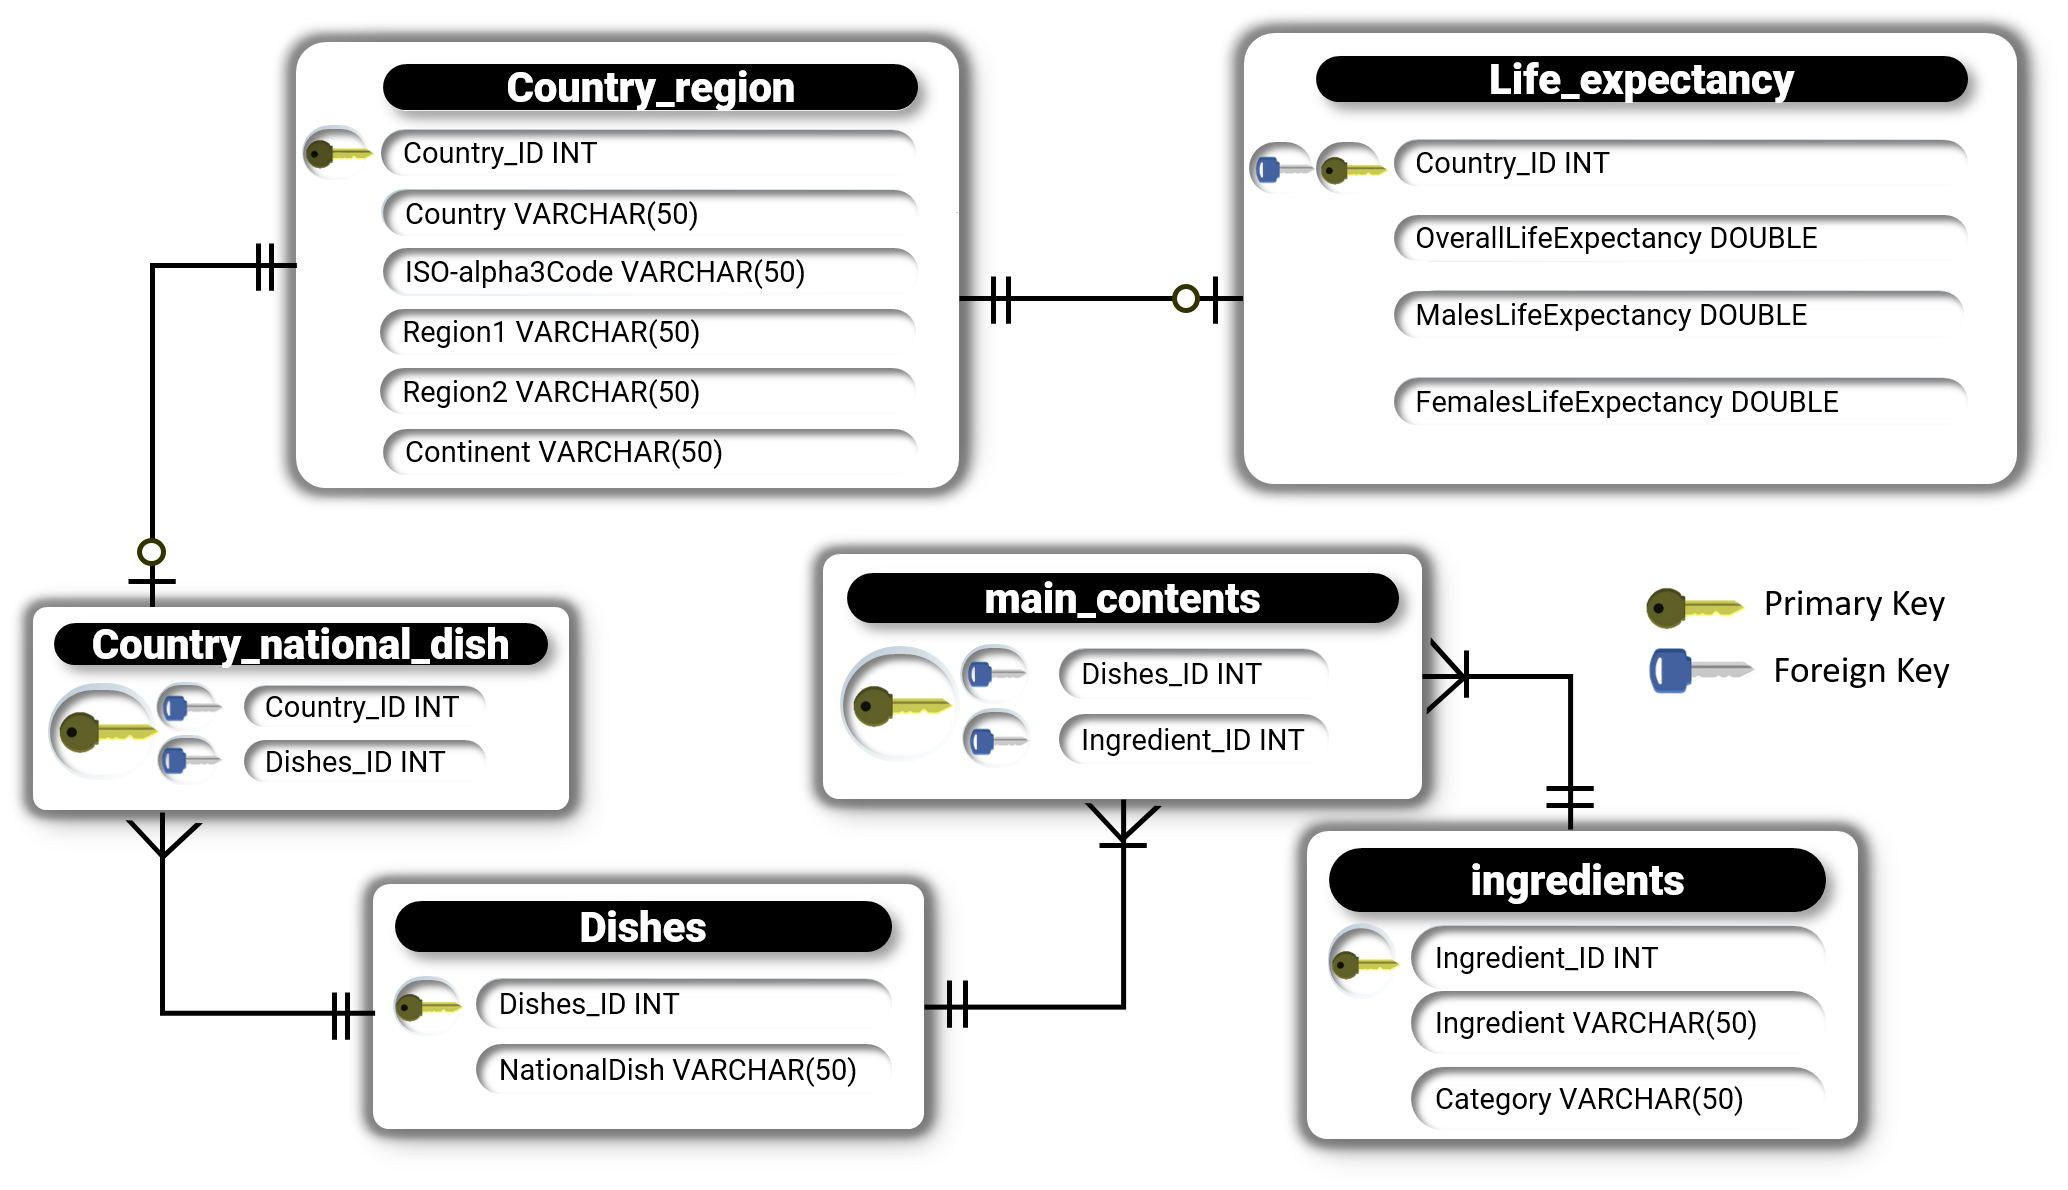

Relationship and Cardinality Explanation
Relationship and Cardinality Explanation
This model was designed to meet industry standards, making it easier to query and update.
Relationship 1: Country_region to Life_expectancy
1 : 0..1 - one-to-zero or one relationship
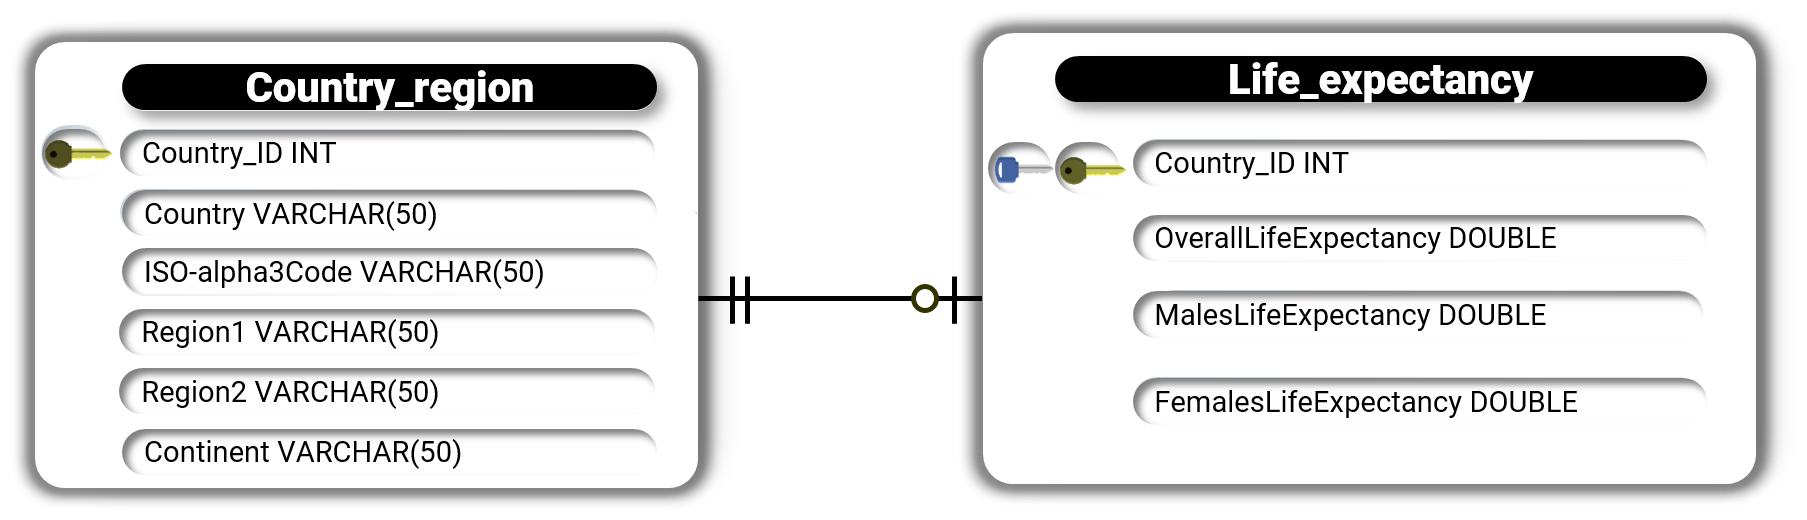
Countries listed in the Country_region table may have either one or no life expectancies assigned to them. On the other hand, each country in the Life_expectancy table is associated with exactly one region.

In the Life_expectancy table, the Country_ID column acts as both the primary key and a foreign key that links to the Country_region table.
Relationship 2: Country_region, country_national_dish, Dishes
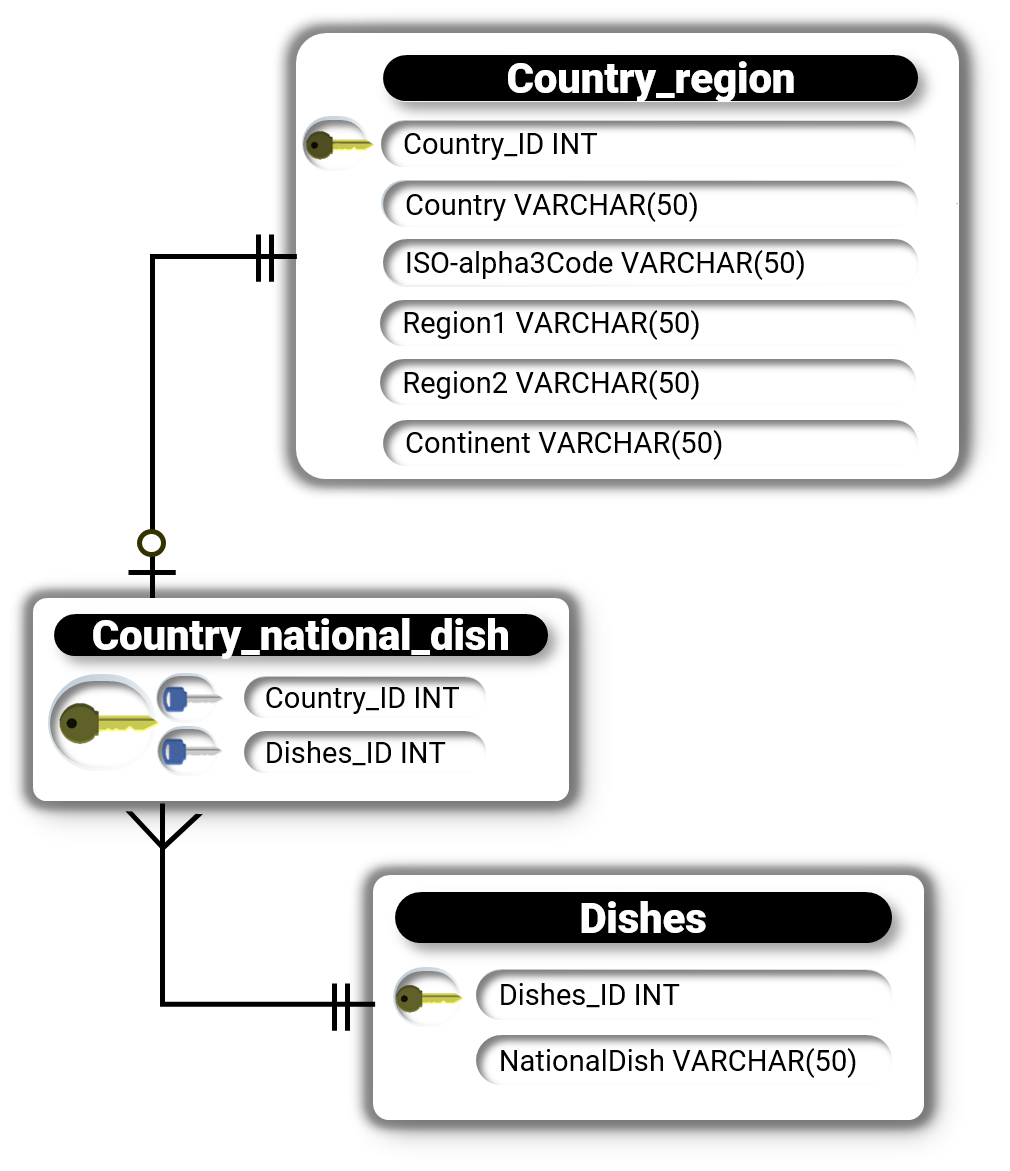
The Country_national_dish table functions as a bridge linking the Country_region and Dishes tables. It's worth mentioning that not every country in the Country_region table has a dish linked to it, and for those that do, only one dish is assigned as per the project scope. Interestingly, some dishes are celebrated as national dishes across various countries.

In the Country_national_dish table, the Dishes_ID and Country_ID columns served as foreign keys, and their unique pairing was set as the primary key.
Relationship 3: Dishes, main_contents, ingredients
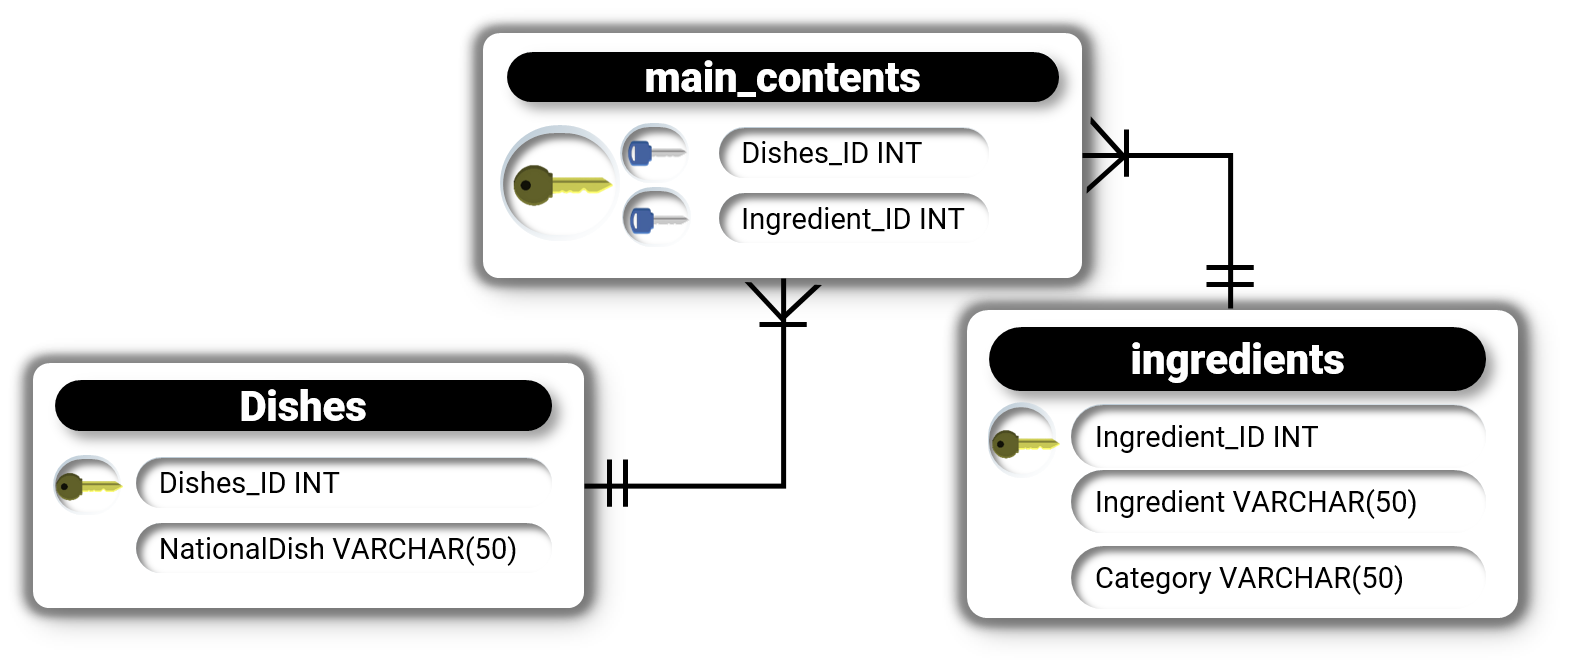
Similar to the previously mentioned relationship, the Main_Contents table acted as the connecting table. Each dish could contain multiple ingredients, and each ingredient could be part of several dishes.
Using MySQL Workbench:
- Designed an Entity relationship diagram (ERD). ERD
- With a click of a button, generated a schema creation script using forward engineering. Script
- Built the database by populating it with the CSV files. DB Build